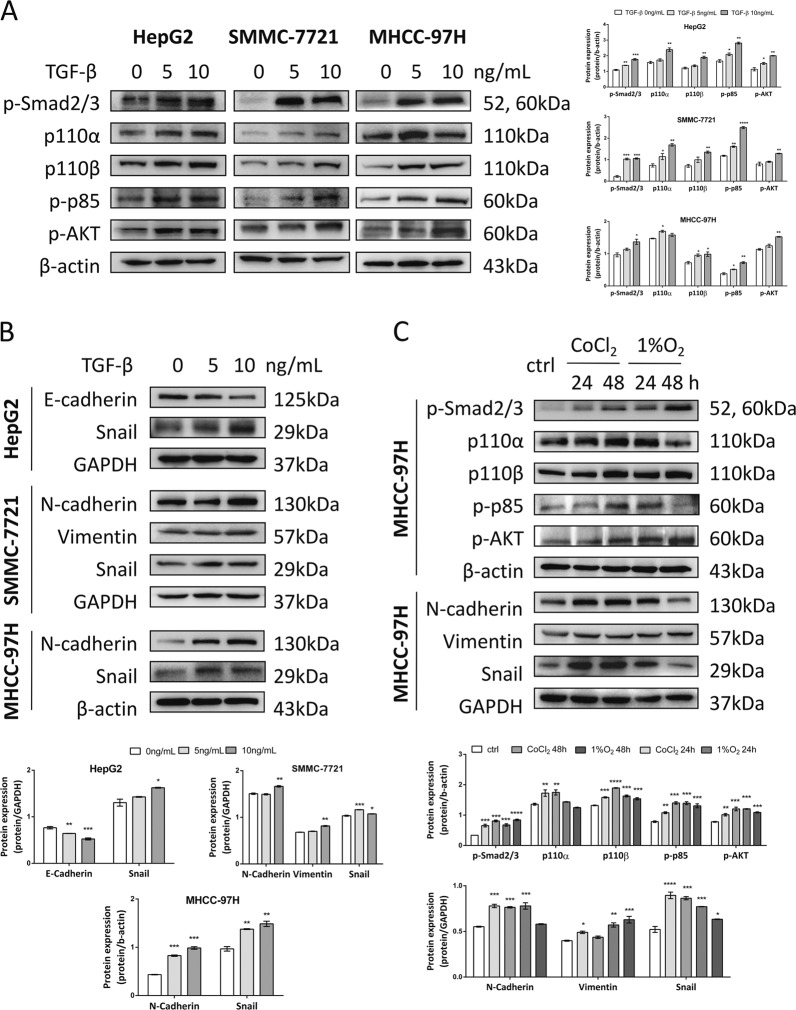
Fig. 5. Hypoxia and TGF-β induced EMT via Smad and PI3K-AKT pathways in HCC cells.
a Western blot analysis of p-Smad2/3, p100α, p110β, p-p85, and p-AKT expression were shown in 0, 5, and 10 ng/mL TGF-β-stimulated HepG2, SMMC-7721, and MHCC-97H cells. Quantification plots are shown on the right. b E-cadherin, N-cadherin, Snail and Vimentin expression levels were assessed by western blotting in TGF-β-stimulated HepG2, SMMC-7721 and MHCC-97H cells. Quantification plots are shown below. c MHCC-97H cells treated with 100 μM CoCl2 or cultured in 1% O2 for indicated time. Protein expression of p-Smad2/3, p100α, p110β, p-p85, p-AKT, N-cadherin, Snail, and Vimentin was analyzed by western blotting. GAPDH and β-actin served as controls. Quantification plots are shown below. Data were expressed as mean ± SEM (n = 3). *P < 0.05, **P < 0.01, ***P < 0.001, ****P < 0.0001 compared with untreated control cells. The results shown were representative of three independent experiments.

