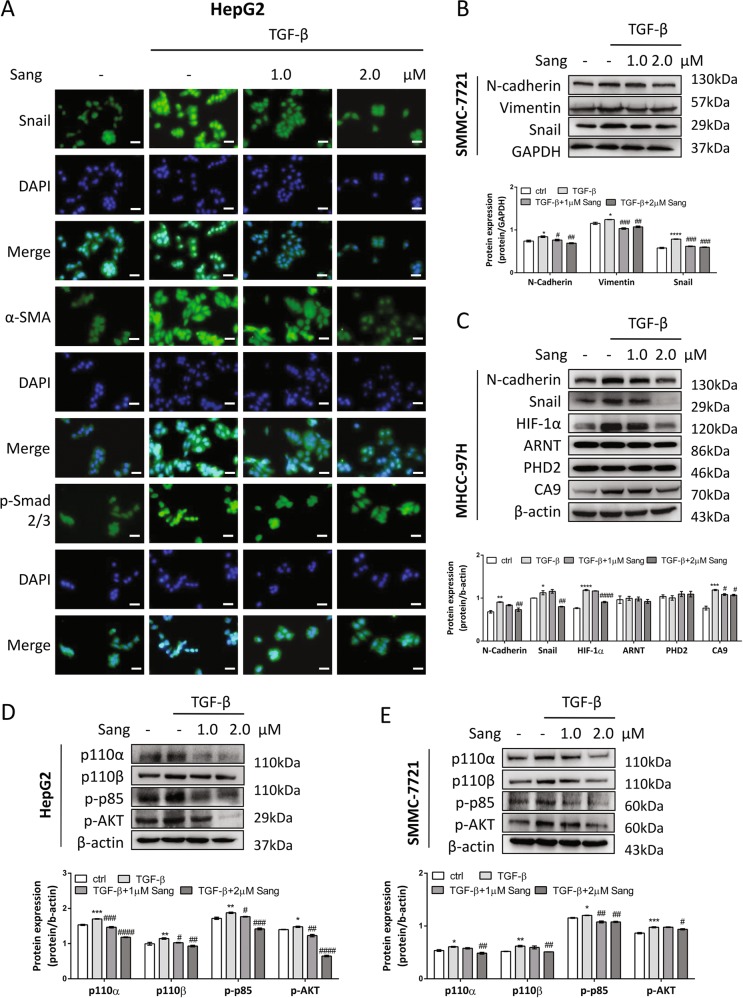
Fig. 7. Sanguinarine inhibited TGF-β-induced EMT in vitro.
a HepG2 cells were treated with different concentrations of sanguinarine in the absence or presence of 10 ng/mL TGF-β for 24 h. Snail (green), α-SMA (green), p-Smad2/3 (green), DAPI (blue) staining and 2-channel merged images indicated the nuclear translocation of Snail and p-Smad2/3, and expression of α-SMA. The results shown were representative of three independent experiments. Scale bars, 200 μm. b SMMC-7721 cells were treated with different concentrations of sanguinarine in the absence or presence of 10 ng/mL TGF-β. Protein levels of N-cadherin, Vimentin, and Snail were analyzed by western blotting. Quantification plots are shown below. c MHCC-97H cells were treated with different concentrations of sanguinarine in the absence or presence of 10 ng/mL TGF-β. Protein levels of N-cadherin, Snail, HIF-1α, ARNT, PHD2, and CA9 were analyzed by western blotting. GAPDH or β-actin served as controls. Quantification plots are shown below. Western blot analysis of p100α, p110β, p-p85, and p-AKT expression were demonstrated in d HepG2 and e SMMC-7721 cells treated with indicated concentrations of sanguinarine in the absence or presence of 10 ng/mL TGF-β for 48 h. Quantification plots are shown below. Data were expressed as mean ± SEM (n = 3). *P < 0.05, **P < 0.01, ***P < 0.001, ****P < 0.0001 compared with untreated control cells. The results shown were representative of three independent experiments. #P < 0.05, ##P < 0.01, ###P < 0.001, ####P < 0.0001 one-way ANOVA followed by Bonferroni posttest in comparison with TGF-β-treated samples.

