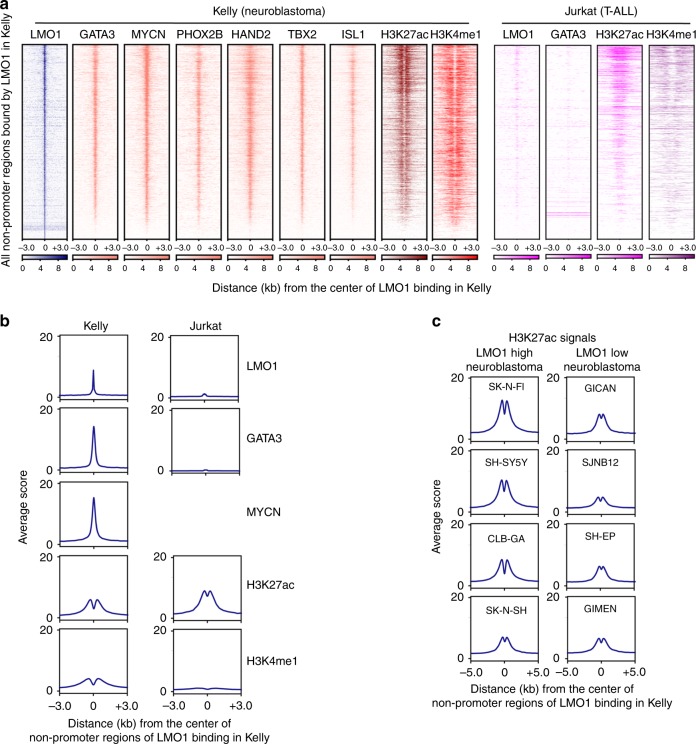
Fig. 2.
LMO1 co-occupies targets with the members of the ADRN CRC. a The LMO1-bound nonpromoter loci were first identified in Kelly cells. Density plots show the distribution of LMO1, GATA3, MYCN, PHOX2B, HAND2, TBX2 and ISL1, H3K27ac and H3K4me1 signals at the LMO1-bound regions (±3 kb from binding sites) in Kelly and LMO1, GATA3, H3K27ac and H3K4me1 signals at the same regions in Jurkat cells. The color scale shows the intensity of the distribution signal. b Metagene plots show distribution of LMO1, GATA3, MYCN, H3K27ac, and H3K4me1 signals at the LMO1-bound regions (±3 kb from binding sites) in Kelly and Jurkat cells. c Metagene plots show distribution of H3K27ac signals at the LMO1-bound regions (±5 kb from binding sites) in various neuroblastoma cell lines. Cell lines were classified based on the expression level of LMO1 mRNA.

