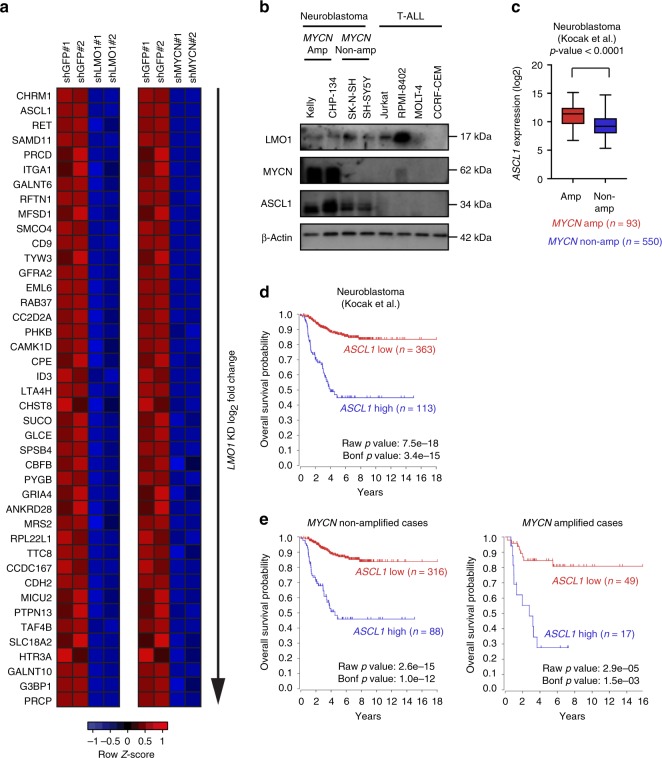
Fig. 3.
ASCL1 a high-confidence LMO1 target in neuroblastoma cells. a Heatmap image represents gene expression changes of selected genes after knockdown of LMO1 or MYCN in Kelly cells. The genes were ordered based on log2 fold-change values between control and LMO1 knockdown. The color scale represents row z-scores. b Protein expression of LMO1, MYCN, and ASCL1 in a panel of neuroblastoma and T-ALL cell lines were analyzed by western blot. β-actin was used as an internal control. MYCN-amplified (amp) and nonamplified (non-amp) cell lines are indicted. c A total of 643 primary neuroblastoma cases in the Kocak cohort31 were classified into two groups: with MYCN amplification (n = 93), and without MYCN amplification (n = 550). ASCL1 mRNA expression were shown in each group. Data are represented as box plots where the middle line indicates the median, the lower and upper hinges correspond to the first and third quartiles, the lowest datum indicates the minimum (within the 1.5 IQR of the lower quartile), and the highest datum indicates the maximum (within the 1.5 IQR of the upper quartile). The p values by the Mann–Whitney test are indicated. d The survival curve analysis for primary neuroblastoma samples in the Kocak cohort31 was done using the R2 database. The samples for which the prognostic data are available were classified into two groups (ASCL1-high and low) by the Kaplan Scan method, which calculates the optimum cutoff based on statistical testing. The raw p value and Bonferroni-corrected p value are shown. The Kaplan–Meier curve analysis for each group was done using the R2 database. e Primary neuroblastoma cases for which the prognostic data are available from the Kocak cohort31 were classified into two groups: without MYCN amplification (n = 404; left), and with MYCN amplification (n = 66; right).

