Figure 4.
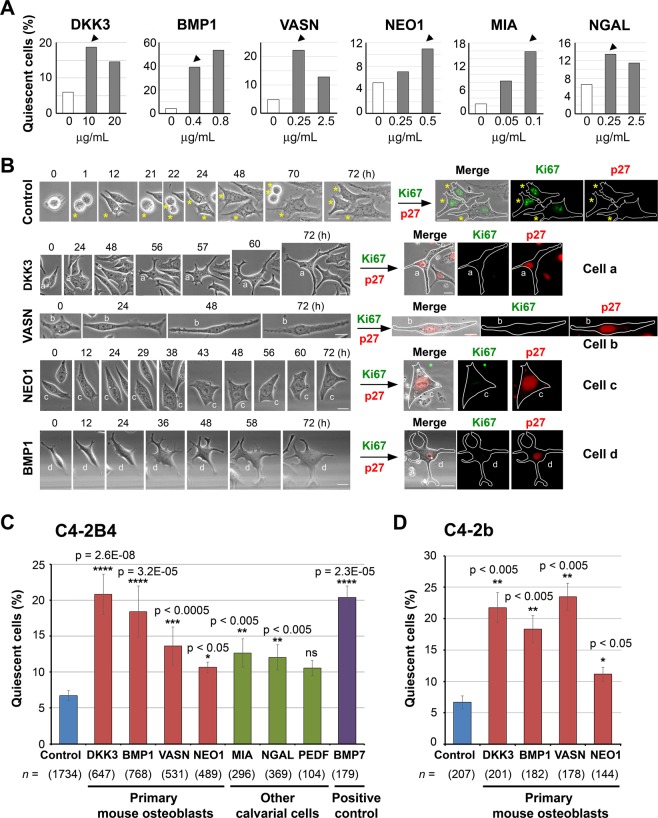
Bone-secreted factors induce cellular quiescence in PCa cells. (A) Dose response. C4-2B4 PCa cells were treated without or with various recombinant human bone-secreted factors at different concentrations and analyzed by live-cell imaging as in Fig. 1. About 100 cells were monitored for each factor at each concentration. Using this approach, we obtained an empirically-derived optimal concentration to be used for each factor (arrowheads): DKK3 (10 µg/mL), BMP1 (0.4 µg/mL), VASN (0.25 µg/mL), NEO1 (0.5 µg/mL), MIA (0.1 µg/mL), and NGAL (0.25 µg/mL). (B) (Left) Phase contrast brightfield images. Cells were plated in a Q4 glass-bottom dish, treated with and without various recombinant proteins, and analyzed by live-cell imaging. Representative images are shown for control cells and cells treated with recombinant human DKK3 (cell a), vasorin (cell b), neogenin (cell c), and BMP1 (cell d). Asterisks (*) follow a control cell through 3 cell divisions. Round cells are cells undergoing mitosis. (Right) Immunofluorescence images. At the end of live-cell imaging, cells were immediately fixed and co-immnostained for Ki67 (proliferation marker) and p27 (dormancy marker), and merged with phase contrast images. Cell outlines are traced for ease of view. All bars, 20 µm. (C) C4-2B4 cells were treated with various bone-secreted factors, using concentrations as determined in (A), and analyzed by live-cell imaging. PEDF was used at 0.25 µg/ml47. The dormancy factor BMP7 (0.4 µg/ml)50 was used as a positive control. % quiescent cells that did not divide relative to total cells counted were quantified (mean ± s.e.m), except for PEDF and BMP7 (mean ± s.d.). n, number of cells monitored. N, number of independent experiments for control (N = 24), DKK3 (N = 10), BMP1 (N = 10), vasorin (N = 9), neogenin (N = 4), MIA (N = 4), NGAL (N = 6), PEDF (N = 2), BMP7 (N = 2). P values were by t test. ns, not significant. (D) C4-2b cells were treated with various bone-secreted factors as indicated, monitored by live-cell imaging, and analyzed as in (C). n, number of cells monitored. N, number of independent experiments for control (N = 3), DKK3 (N = 3), BMP1 (N = 3), vasorin (N = 2), neogenin (N = 2). P values were by t test.

