Figure 3.

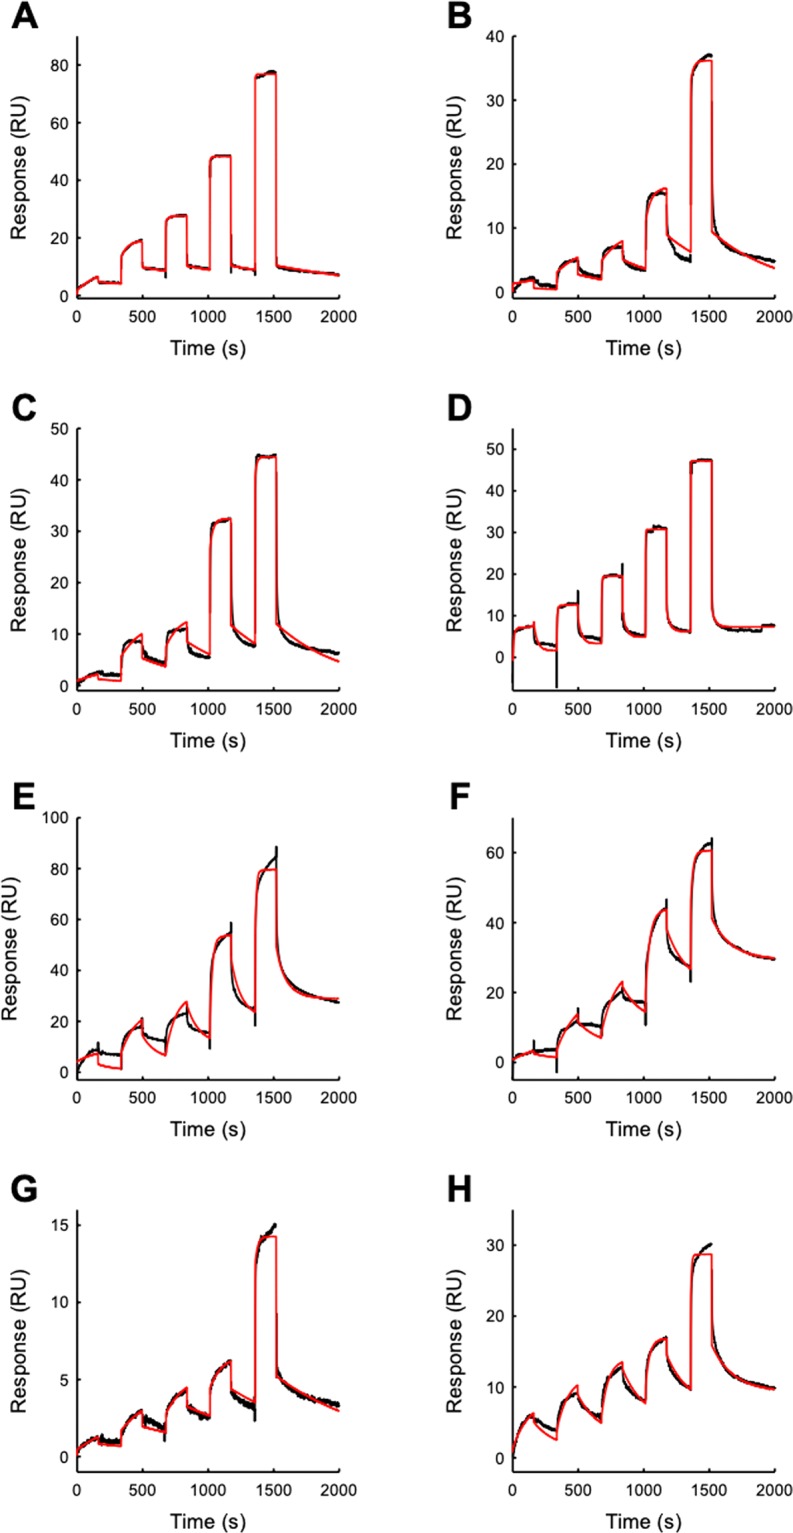
SPR sensorgrams (black curves) of the response (Resonance Units, RU) versus time of the single-cycle kinetics performed by injecting five increasing concentrations (0.01, 0.05, 0.1, 0.5, 1 µM) of Hb over the IsdB-functionalized substrate. The red curves are the fitting with either a 1:1 or a two state irreversible binding model. Fitting parameters are reported in Table 2. The resulting kinetic parameters are reported in Table 2. (A) IsdB-OxyHb (1:1) (B) IsdB-α-semiOxyHb (1:1) (C) IsdB-β-semiOxyHb (1:1) (D) IsdB-MetHb (two-state irreversible) (E) IsdB-α-semiMetHb (two-state irreversible) (F) IsdB-β-semiMetHb (two-state irreversible) (G) IsdBY440A-OxyHb (1:1) (H) IsdBY440A-MetHb (two-state irreversible).
