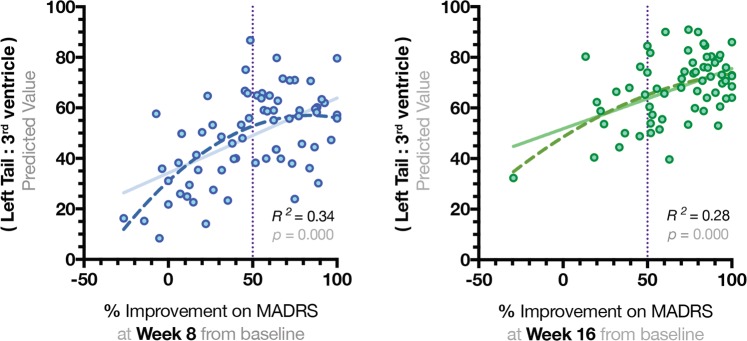
Fig. 2.
Quadratic regression model to represent significant associations between the results of total Montgomery–Åsberg Depression Rating Scale and proportional values of the left hippocampal tail. Hippocampal tail (Ht) volumes were divided by volumes of the 3rd ventricle and regressed with total MADRS scores. Quadratic non-linear function appeared to be the best fit to explain the variance in MADRS scores at weeks 8 and 16

