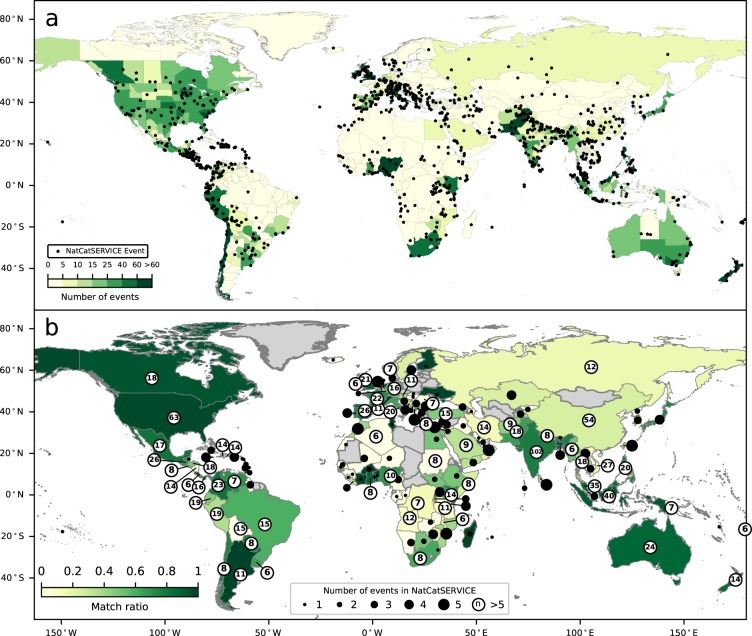
Fig. 4.
Comparison of detected events and NatCatSERVICE. Panel a shows the number of events detected by our algorithm at admin 1 level, either aggregated by country or shown at admin 1 level (yellow to green) and flood events in Munich RE’s NatCatSERVICE (black dots) between August 29, 2014 and December 31, 2016 (model settings: sensitive). Panel b shows the match ratio [0–1] between NatCatSERVICE and our events detected at the level of admin 1 subdivisions aggregated per country. The labels show the total number of flood events recorded in NatCatSERVICE between August 29, 2014 and December 31, 2016 (model settings: sensitive).

