Figure 1.
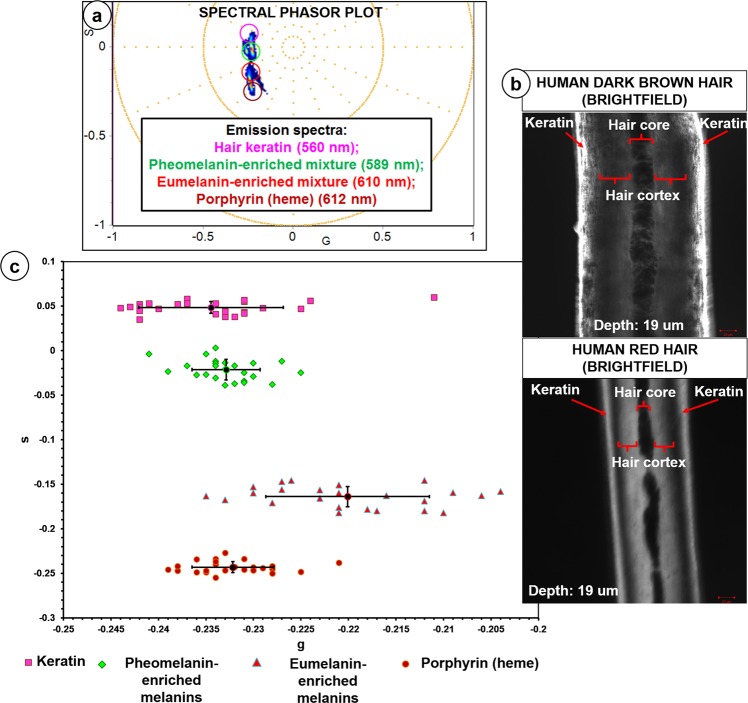
2PM spectral phasor profiling of fluorophore controls. Spectral phasor distribution profiles of various fluorophores used as controls for 2PM spectral phasor segmentations of intracellular melanin and surrounding choroidal components. (a) The peak wavelengths of the spectral phasor center of mass related to fluorophores: Hair keratin (560 nm), Dark brown human hair cortex (melanin pigmentation: ‘dark’ to ‘very dark’; eumelanin-enriched; 610 nm), Red human hair cortex (melanin pigmentation: ‘mixed’ to ‘very light’; pheomelanin-enriched; 589 nm), Porphyrin complex (heme) in RBCs (612 nm). (b) Human dark brown and red hair cortex were examined at z depth of 19 µm. (c) Scatter plot of 24 average points from the spectral phasor distributions corresponding to the following fluorophores (n = 3): hair keratin (K), pheomelanin-enriched red human hair cortex (RH), eumelanin-enriched dark brown human hair cortex (DH) and porphyrin complex (heme) (H) in RBCs. The standard deviation (SD) for each population of average points was generated. The differences, in terms of s values, between the following pairs of average point populations (K versus RH; K versus DH; RH versus DH; H versus RH; H versus DH) were statistically significant (t test, P < 0.05). G = X coordinate of phasor transform (‘real’ unitless phasor component), S = Y coordinate of phasor transform (‘imaginary’ unitless phasor component).

