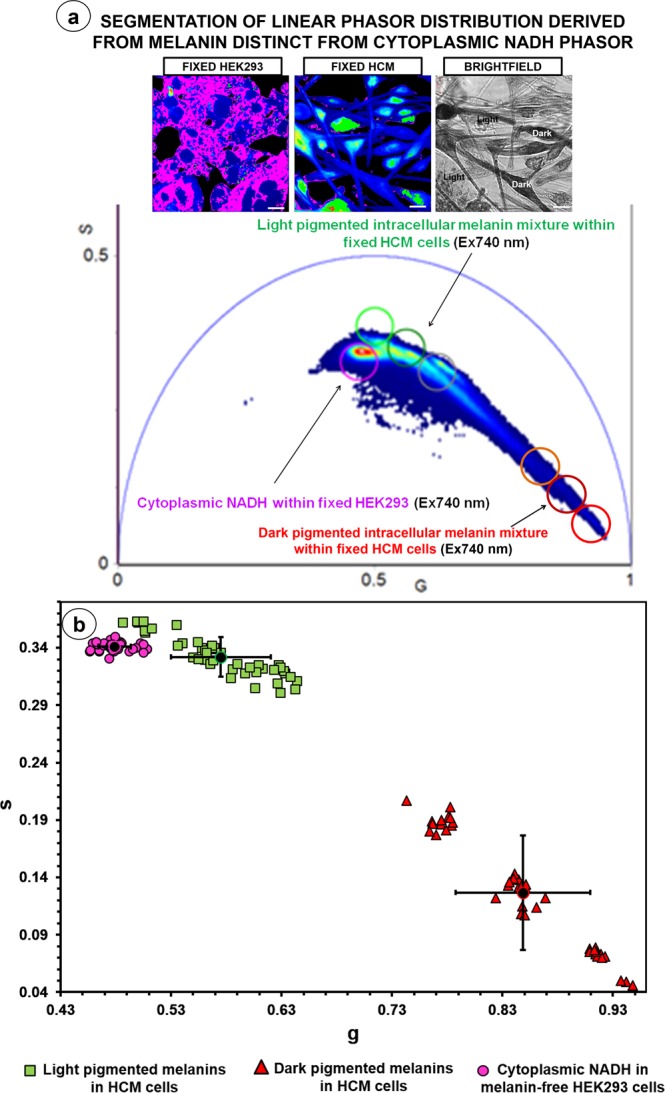
Figure 6.

2PM FLIM phasor distribution from heterogeneous pigmented intracellular melanin was statistically distinct but proximal from cytoplasmic NADH phasor distribution. Cytoplasmic NADH within the melanin-free HEK293 cells was optimally excited at 740 nm, and 2PM FLIM data acquisition and phasor analysis were also performed at this wavelength on fixed HCMs. (a) The merged FLIM phasor distribution showed that the phasor distribution identified from cytoplasmic NADH and light pigmented melanins in HCMs (n = 3) was distinct. (b) Scatter plot of 42 average points from the FLIM phasor distributions corresponding to the light and dark pigmented melanins within fixed HCMs (n = 3), and cytoplasmic NADH. The SD for each population of average points was generated. The difference, in terms of s values, between the light pigmented melanin and cytoplasmic NADH populations was statistically significant (t test, P = 0.002). The difference (in s values) between the dark pigmented melanin and cytoplasmic NADH populations was also statistically significant (t test, P < 0.05). SD = Standard deviation, G = X coordinate of phasor transform (‘real’ unitless phasor component), S = Y coordinate of phasor transform (‘imaginary’ unitless phasor component), Scale bar = 10 μm.
