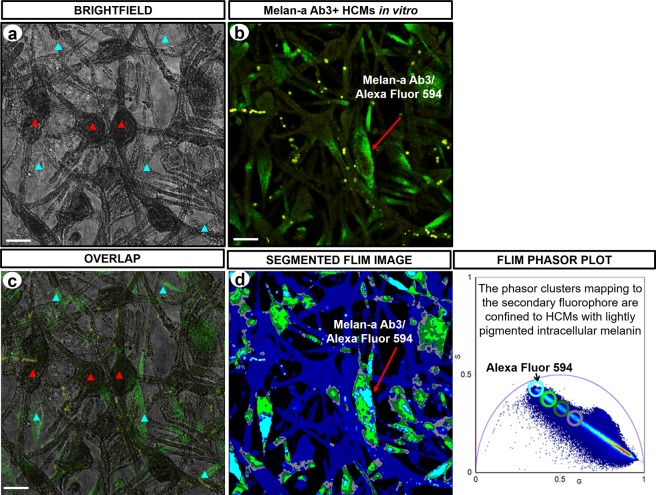
Figure 7.
Imaging of immunolabeled cultured HCMs. (a) Brightfield image of fixed HCMs in vitro. Red arrow head indicates cellular regions with very dark pigmented melanin. Blue arrow head indicates cellular regions with lightly pigmented melanin. (b) Image of fluorescence emission from HCMs showing melanosome positive Melan-A Ab3/Alexa Fluor 594 immunolabeling. Figure (c) displays the overlapped images of (a,b) that identifies the cellular regions where fluorescence emission can be detected. Fluorescence emission was clearly detected in light pigmented cellular regions, however, emitted fluorescence was limited in dark pigmented cellular regions, identified with a high eumelanin/pheomelanin ratio. (d) Image of segmented FLIM phasors derived from intracellular melanin of the immunolabeled HCMs. Phasor clusters mapping to the Melan-A Ab3/Alexa Fluor 594 immunolabel were confined to HCMs with lightly pigmented melanins. G = X coordinate of phasor transform (‘real’ unitless phasor component), S = Y coordinate of phasor transform (‘imaginary’ unitless phasor component), Scale bar = 10 μm.

