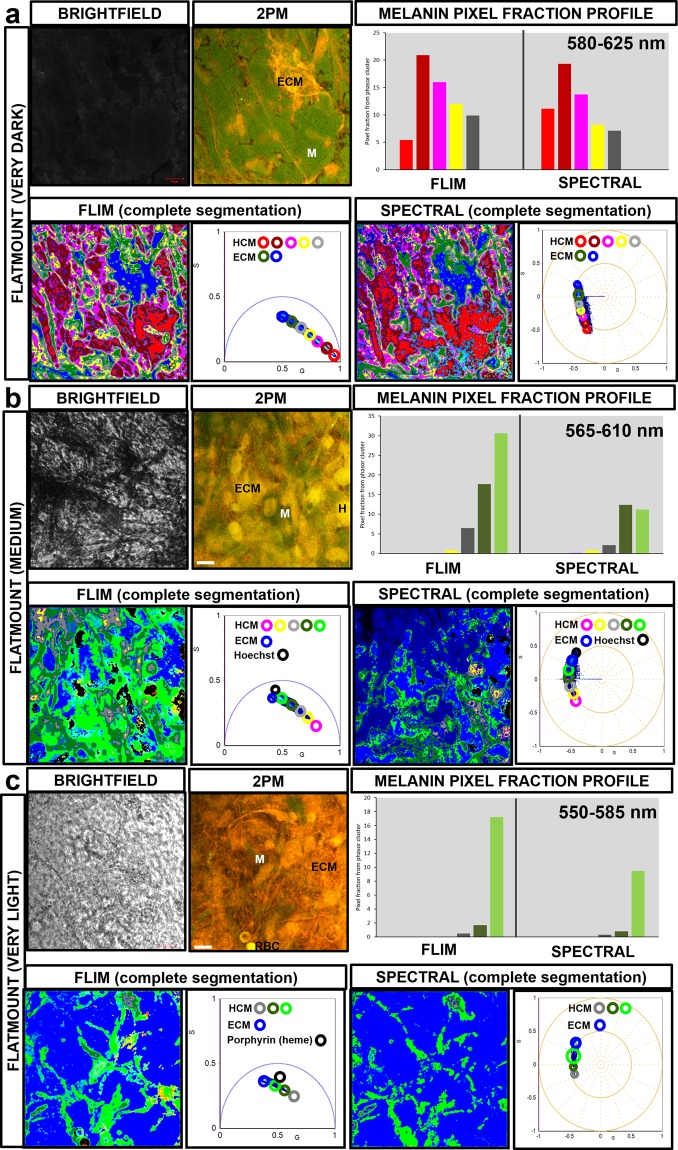
Figure 8.
2PM FLIM/spectral phasor distribution mapping to HCM-localized melanins and surrounding human choroidal flatmount tissue. The image segmented FLIM/spectral phasor clusters mapping to (a) ‘very dark’ pigmented HCMs displayed short average fluorescence lifetimes/emission spectra: 580 to 625 nm. FLIM/spectral phasor clusters mapping to (b) ‘medium’ pigmented HCMs had longer fluorescence lifetimes/emission spectra: 565 to 610 nm. FLIM/spectral phasor clusters mapping to (c) ‘very light’ HCMs showed the longest fluorescence lifetimes/emission spectra: 550 to 585 nm. The unmixed FLIM phasor clusters mapped to fluorophores contained in ECM, RBCs and Hoechst 33342 nucleic DNA binding stain were distinct from the HCM-matched clusters but image segmented spectral phasor clusters showed overlapping emission spectra. M = HCM, ECM = Extracellular matrix, H = Hoechst 33342, RBC = Red blood cell, G = X coordinate of phasor transform (‘real’ unitless phasor component), S = Y coordinate of phasor transform (‘imaginary’ unitless phasor component), Scale bar = 10 μm.

