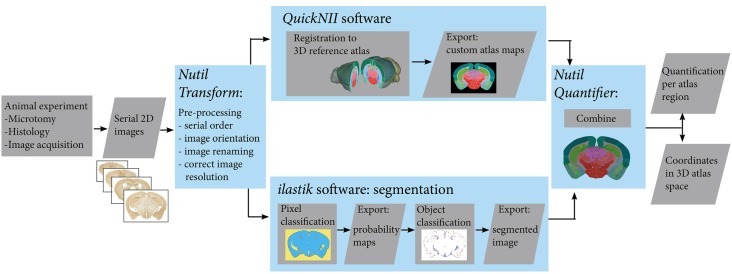
Figure 1.
Workflow for automated quantification and spatial analysis. Diagram showing key steps of the workflow (blue frames). After sectioning and labelling, brain sections are digitalised. Serial section images are pre-processed, and then registered to a 3-D reference atlas space using the QuickNII tool. The same images are segmented using the ilastik tool. Exported custom atlas maps and segmented images are then combined in the Nutil tool in order to extract quantification of objects in atlas brain regions as well as 3D coordinates of the objects.

