Figure 5.

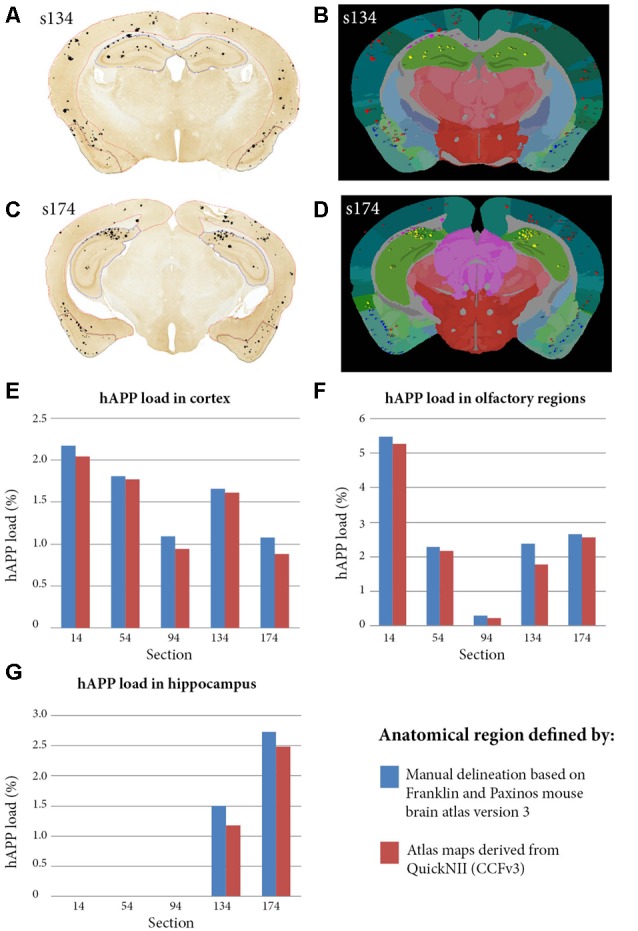
Comparison of hAPP load outputs in three anatomical brain regions defined by two alternative anatomical delineation methods. Brain region-specific hAPP load was calculated by dividing the area occupied by hAPP labelling within the selected brain region, by the total area occupied by the brain region. The calculations were restricted to plaques that were immuno-labelled with the hAPP antibody (1D1). For the first method, five brain section images were segmented with ilastik and visualised on top of the sections to allow manual delineation of brain regions. The cortex, olfactory region and hippocampus were delineated with NIH ImageJ with guidance from the Franklin and Paxinos mouse brain atlas version 3 (panels A,C show the cortex, olfactory region and hippocampus delineated in red, blue and yellow in section s134 and s174 respectively). The analyse function in NIH Image J was used to quantify hAPP load in the delineated regions. For the second method, the five segmentations were processed with the QUINT workflow with input from the QuickNII derived atlas maps (panels B,D show examples for s134 and s174 respectively). hAPP loads were extracted for the cortex, olfactory region and hippocampus from the output reports. Panels (E–G) compare hAPP loads in the cortex, olfactory regions and hippocampus respectively for the five sections, with the loads calculated by the two alternative methods described.
