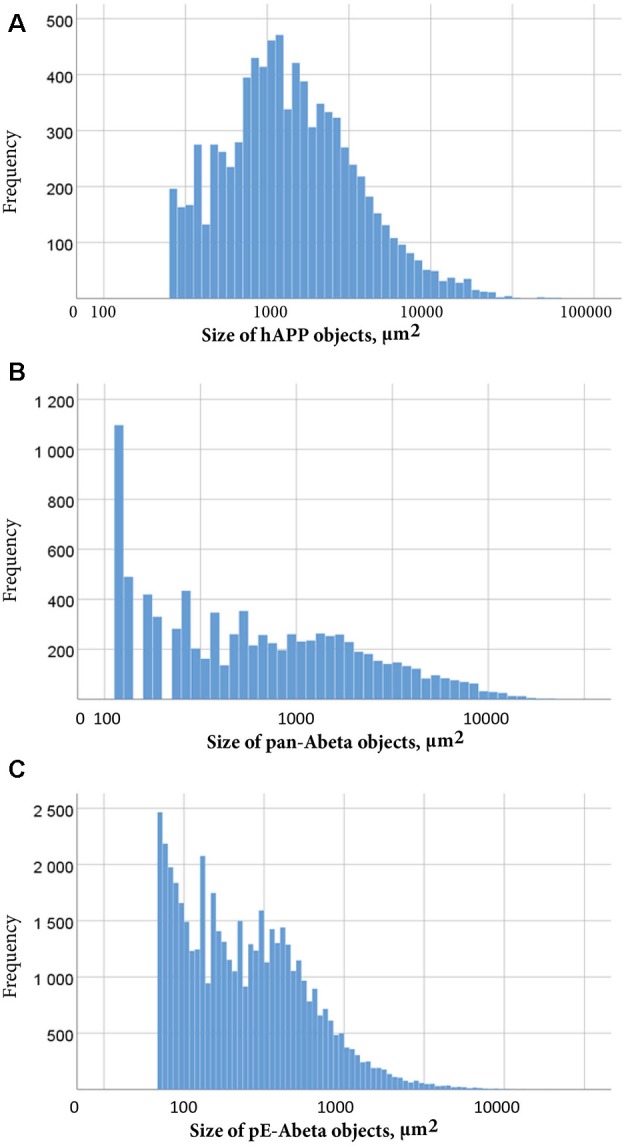
Figure 8.

Size distribution of objects labelled for hAPP (A), pan-Aβ (B) and pE-Aβ (C) in a whole T2576 mouse brain series. Object size in μm2 is represented on the x-axis on a common logarithmic scale with frequency on the y-axis. To remove false positive objects, minimum object size cut-offs of 258 μm2, 112 μm2 and 56 μm2 were applied to the hAPP (A), pan-Aβ (B) and pE-Aβ (C) series, respectively.
