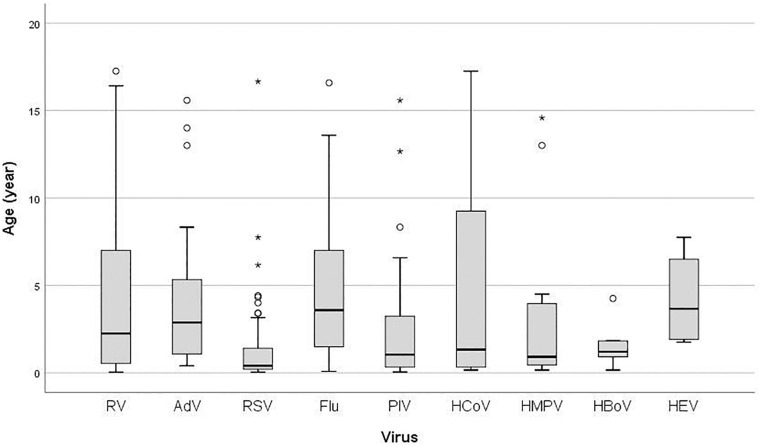
FIGURE 1.
Box plot of patient’s age infected with: RV, rhinovirus; AdV, adenovirus; RSV, respiratory syncytial virus; Flu, Influenza virus type A and B; PIV, parainfluenza virus type 1–4; HCoV, coronavirus 229E/NL63 and OC43; HMPV, human metapneumovirus; HBoV, human bocavirus; HEV, human enterovirus; the ends of the box are the upper and lower quartiles, the median is marked by a vertical line inside the box and the ends of the whiskers represent the minimum and maximum of all of the data; data not included between the whiskers are plotted as an outlier with a dot.

