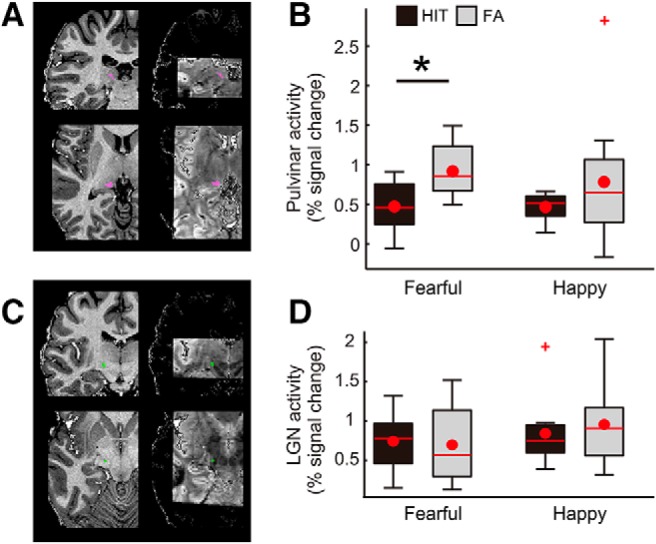
Figure 2.

Activity in the pulvinar and LGN. A, Demonstrations of pulvinar ROI from a representative participant, shown on the anatomic image (left panels) and EPI (right panels). B, Pulvinar showed enhanced activity in FA trials relative to HIT trials during the fearful face detection task (t(10) = –2.94, p = 0.015) but not during the happy face detection task (t(10) = –1.23, p = 0.247). There was no significant interaction between percept type and emotion (F(1,10) = 0.16, p = 0.702). C, Demonstrations of the LGN ROI from an example participant. D, Unlike the pulvinar, the LGN showed no differential activity between the percept types and facial emotions. Box plot shows upper (75%) and lower (25%) quartiles with median (red line) and mean (red dot), with whisker showing maximum and minimum value. An outlier (outside of ±2.7 SDs within a distribution for a given condition) is shown with a red cross; *p < 0.05. See also Extended Data Figures 2-1A, 2-2.
