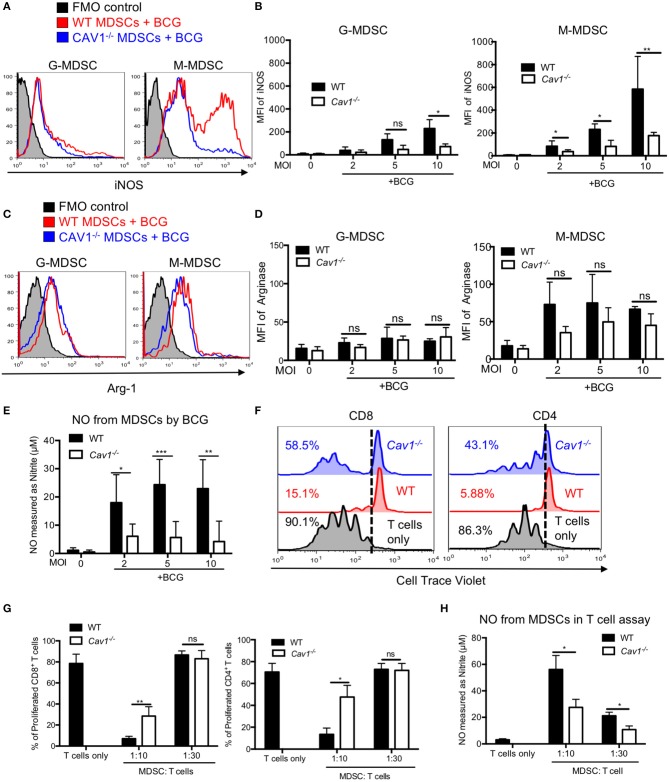
Figure 6.
Cav-1 deficiency impairs iNOS expression and reduced T cell suppression by BCG-activated MDSCs. (A) MDSCs were stimulated with BCG for 16 h at 2, 5, or 10 MOI. Cells were then harvested and G-MDSCs and M-MDSCs were separately analyzed by flow cytometry for intracellular iNOS. (B) Pooled and normalized data of several experiments as performed for (A). (C) Experimental setting as in (A) but staining for intracellular Arg1. (D) Pooled and normalized data of several experiments as performed for (C). (E) Cell supernatants from WT and Cav-1−/− MDSCs were stimulated with BCG-GFP at 2, 5, or 10 MOI for 16 h. Then NO was measured as nitrite by Griess reaction. (F) Suppressor assay for T cell proliferation. Syngeneic lymph node and spleen cells as a source of T cells were labeled with the proliferation dye Cell Trace Violet and then stimulated with anti-CD3 and anti-CD28. Then 1 h BCG pre-activated MDSCs from WT and Cav-1−/− mice were added or, as a control, T cells remained without MDSCs. Co-cultures were analyzed after 3 days. Cells were harvested and stained for CD4 and CD8 and analyzed by FACS. T cell division is analyzed as % proliferating cells. Dotted lines indicate the gate separating Cell Trace Violet low proliferating cells from high non-proliferating cells. (G) Pooled and normalized data of several experiments as performed for F of proliferated CD8+ and CD4+ T cells. (H) Cell supernatants from the suppressor assay were measured for NO production by Griess assay. Data shown are from n = 3–7 independent experiments. ***P < 0.001; **P < 0.01; *P < 0.05; ns, not significant unpaired, two-tailed, student's t-test.

