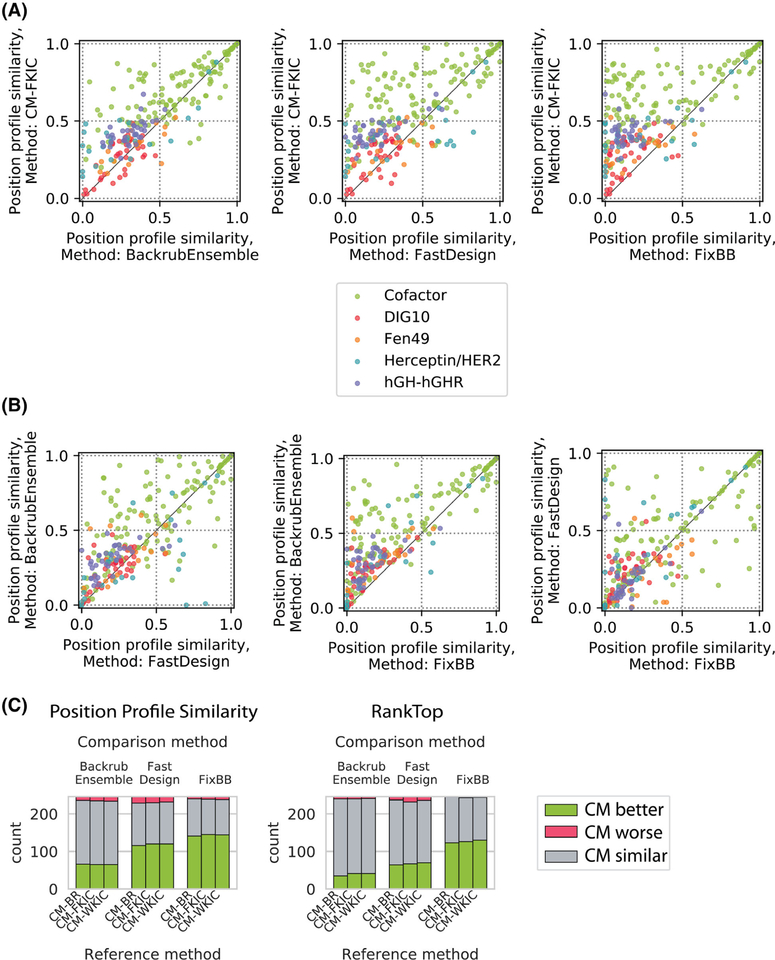
FIGURE 4.
Method performance comparison for profile datasets by sequence position. Shown are the same data as in Figure 3, but plotting individual sequence positions instead of distributions. Colors indicate different datasets. A, Comparison between CM-FKIC and noncoupled methods. Points above the diagonal represent positions where CM-FKIC outperforms the noncoupled method. B, Comparison between noncoupled methods, where points above the diagonal represent positions where BackrubEnsemble outperforms FastDesign (left) or FixBB (middle), or where FastDesign outperforms FixBB (right). C, Summary of position counts classified by whether CoupledMoves (“Reference method”) performs better (green), worse (red) or similar (gray) compared to coupled methods (“Comparison method”). The CoupledMoves reference method is “better” or “worse” than the comparison method when the difference in performance is above or below, respectively, a threshold of ±0.1 for PPS or ± 5 for RankTop. When the difference is within the threshold, the methods are classified as “similar.” CM-FKIC, CoupledMoves with Kinematic Closure using fragments

