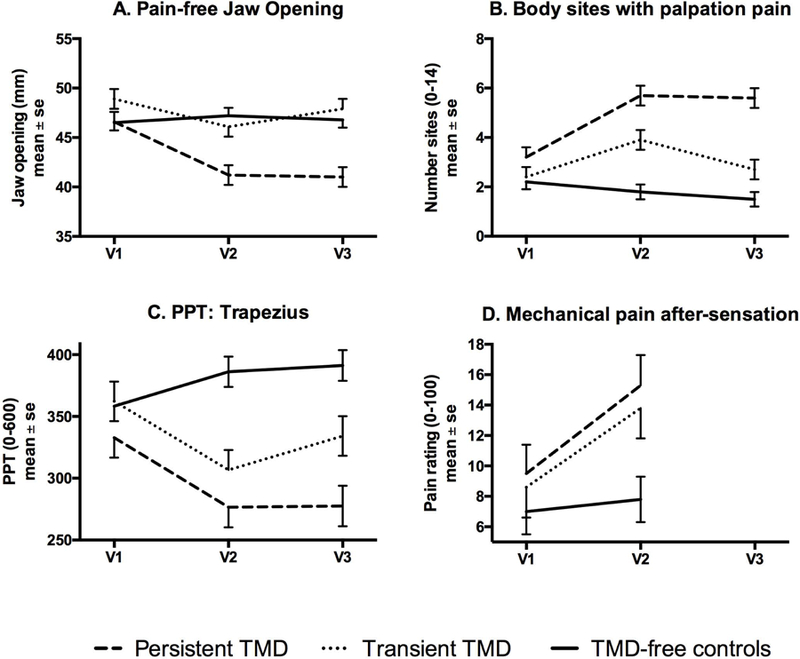
Figure 2. Change across time by TMD-case group for selected variables measured clinically.

The line-plot for each Figure displays mean and standard error at enrollment (v1), onset visit for cases or clinic visit for matched controls (v2), and 6-month recall (v3), for each of the three identified groups: persistent TMD, transient TMD that remits after onset, and TMD-free controls. For plots A-C, the interaction effect was significant, p<0.0001, the group effect was significant, p<0.001, and the visit effect was significant, P<0.004. For plot D, the interaction effect exhibited P=0.075, while the group effect was significant, p=0.034 and the visit effect was significant, P=0.0003.
