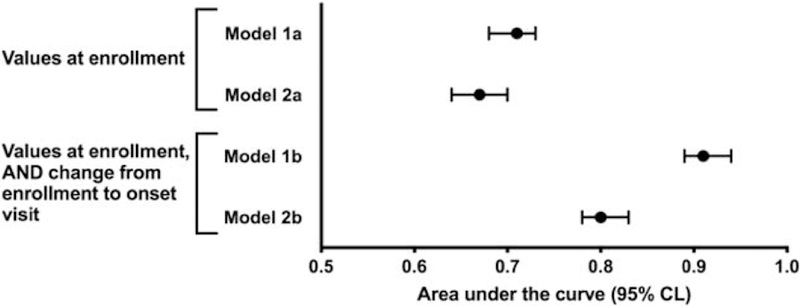
Figure 3. Area under the curve associated with prediction of TMD onset from multivariate cross-domain models.

Model 1 included all variables as listed in Table 1 and also listed in Table S1. Model A refers to enrollment values only, while Model B refers to enrollment values and change values from v1 to v2. Model 2 was restricted by removing variables closely related to the masticatory system: pain-free jaw opening, maximum unassisted jaw opening, non-specific orofacial symptoms, chewing and opening limitation variables as consequences of having a TMD, oral parafunctional behaviors, number of types of headaches, and PPT measured at temporalis, masseter, and TMJ. In all models, the inclusion of change from v1 to v2, in addition to the variables measured at enrollment, improved the model’s predictive value, as measured by area under the curve (AUC). The additional restrictions in Model 2 have no impact on AUC of the enrollment variables but they do affect the AUC associated with the change scores.
