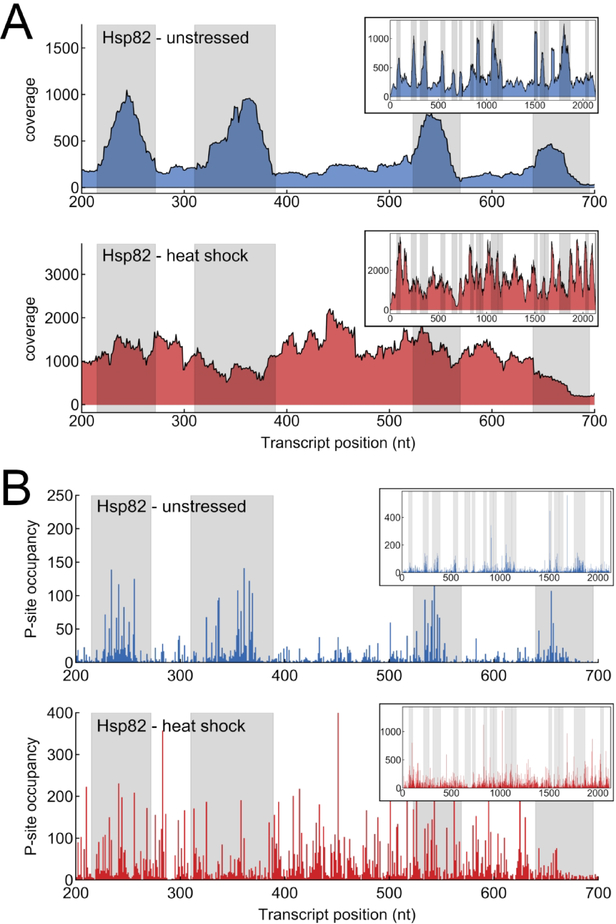
Figure 2.
Ribosome profiling data for a portion of the Hsp82 transcript (positions 200–700). Inset: full transcript. Top: Unstressed conditions (Dataset: SRR1520311). Bottom: Heat shock conditions (Dataset: SRR1520327). Alignment was performed with 2 mismatches allowed and reporting 1 alignment per read (bowtie: k=1, v=2). The gray shaded regions are where the Hsc82 and Hsp82 transcript sequences are identical for at least 30 bps. The data is plotted as: (A) per-nucleotide coverage (number of reads overlapping a nucleotide position) and (B) P-site occupancy (each read counted once, at the position of the 5’ end of read + 12 nt).

