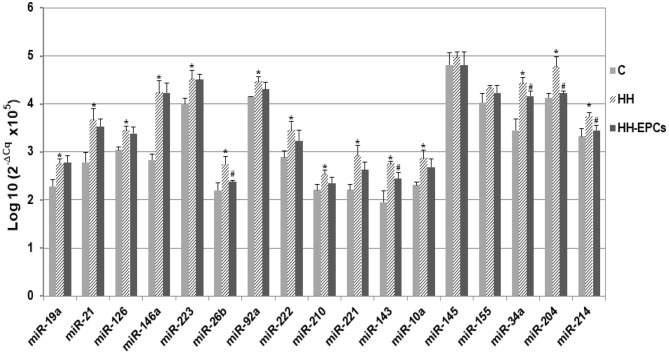
Figure 1.
The quantification of 17 circulating miRNA expressions in plasma obtained from hamster groups: control (C), hypertensive-hyperlipidemic (HH), and HH treated with EPCs (HH-EPCs). Data were expressed as log-transformed values of individual 2−ΔCq values (ΔCq = Cq has-miRNA-Cq cel-miR-39), multiplied to obtain a positive values distribution; The statistically significant differences between the groups were calculated, and represented as *p≤ 0.05 for values vs. C group, and as #p ≤ 0.05 for values vs. HH group (one way ANOVA analysis).

