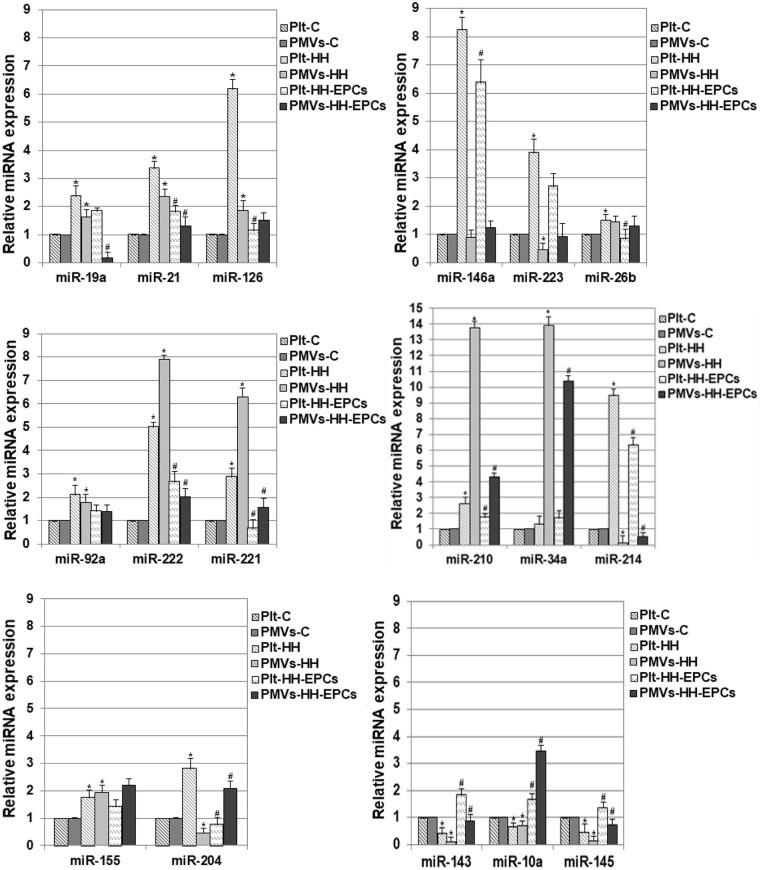
Figure 2.
Relative expression levels of 17 differentially expressed miRNAs in platelets (Plt) and platelet-derivate microvesicles (PMVs) obtained from hamster groups: control (Plt-C and PMVs-C), hypertensive-hyperlipidemic (Plt-HH and PMVs-HH), HH treated with EPCs (Plt-HH-EPCs and PMVs-HH-EPCs). The statistically significant differences between the groups were calculated, and represented as *p ≤ 0.05 for values vs. C group, and as #p ≤ 0.05 for values vs. HH group (one way ANOVA analysis).

