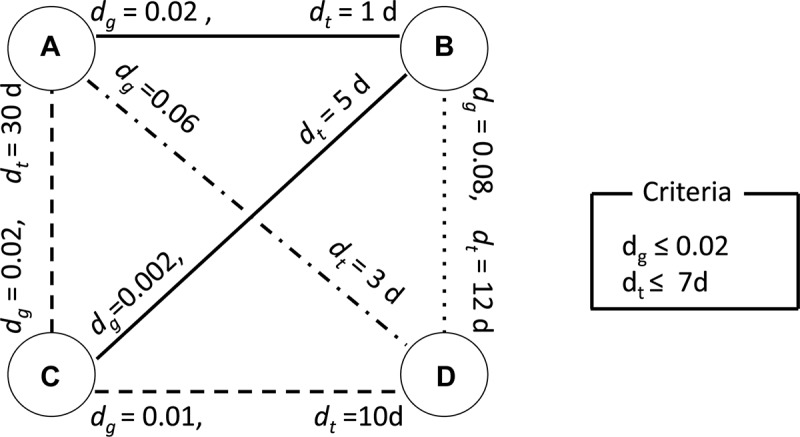
FIGURE 2.

An illustrative example of clustering analysis using two criteria. The nodes A, B, C, and D represent viruses isolated from humans. The dg on each edge connecting two nodes represents the genetic distance between corresponding viruses. The dt on each edge represents the sampling time interval between the corresponding viruses. This example uses 0.02 as clustering threshold for genetic distance and 7 days for sampling time interval. A solid line represents a pair of viruses satisfying both criteria. A dashed line represents a pair of viruses satisfying only the criteria for genetic distance. A dash-dot line represents a pair of viruses satisfying only the criteria for sampling time interval. A dotted line represents a pair of viruses which does not satisfy with any of the criteria.
