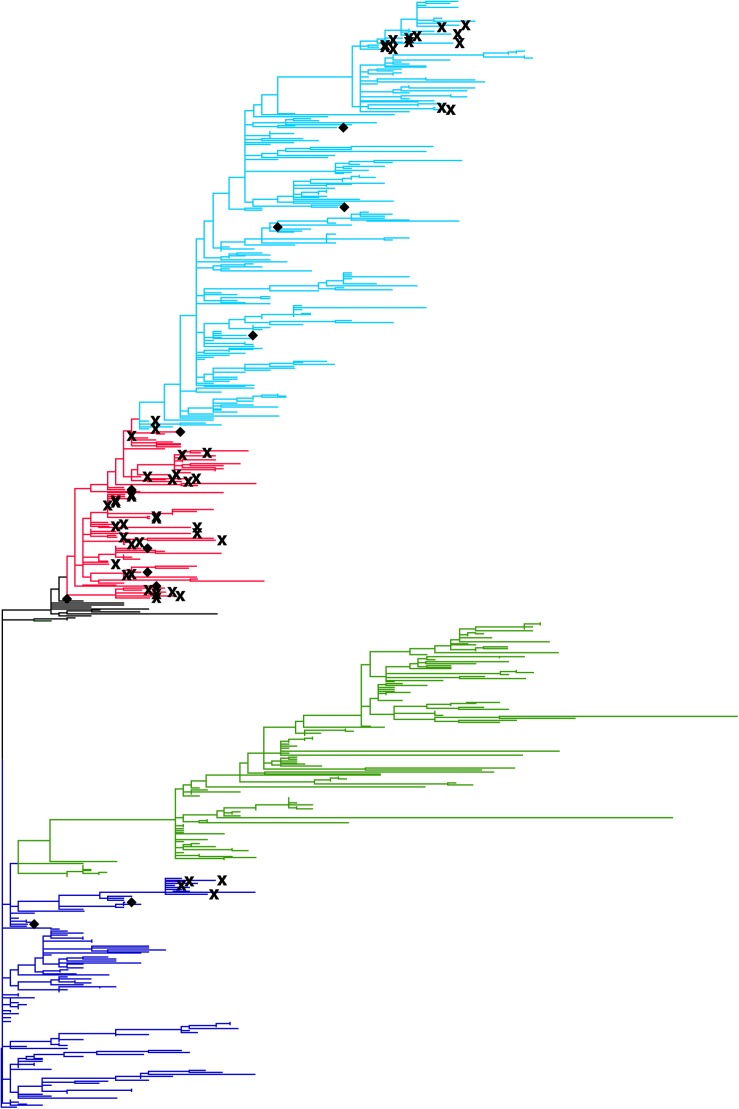
FIGURE 3.
Phylogenetic tree of the HA gene of H5N1 avian influenza A viruses isolated in Egypt. The tree was constructed with the maximum composite likelihood with general time reversible substitution model in MEGA software version 6.06. Tips of the tree represent reported viral sequences. The genetic distance between two viruses are depicted to be proportional to the summation of horizontal distances of branches connecting them. Human viruses are emphasized by marks; human viruses identified in a human cluster containing more than one human isolate were represented by cross marks. Human viruses in a singleton cluster were represented by diamonds. Clade information of H5N1 viruses are shown using different colors; clade 2.2 are shown in blue, clade 2.2.1.1 in green, clade 2.2.1 in red, and clade 2.2.1.2 in light blue.

