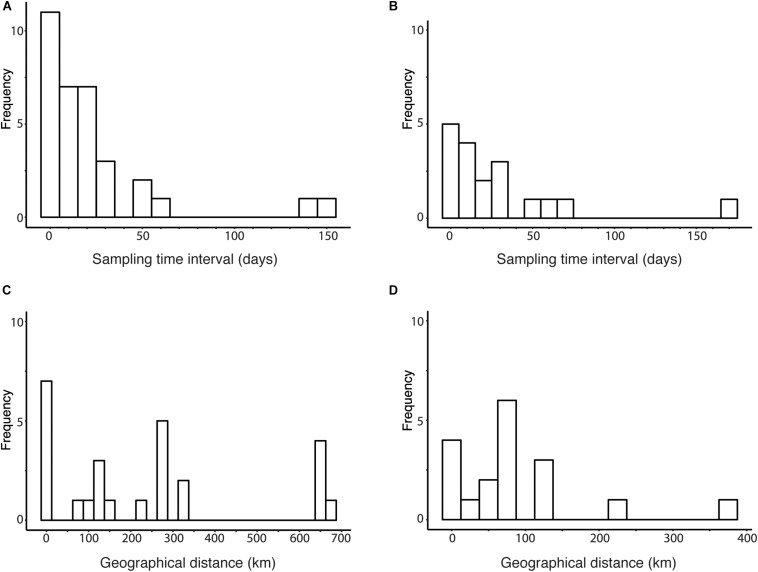
FIGURE 5.
Distribution of sampling time interval and geographical distance among human viruses. (A) Histogram of sampling time intervals between human viruses clustered by genetic distances threshold at the between-household genetic variation. (B) Histogram of sampling time intervals between human viruses clustered by phylogeny and genetic distances threshold at the between-household genetic variation. (C) Histogram of geographical distances between human viruses clustered by genetic distances threshold at the between-household genetic variation. (D) Histogram of geographical distances between human viruses clustered by phylogeny and genetic distances threshold at the between-household genetic variation.

