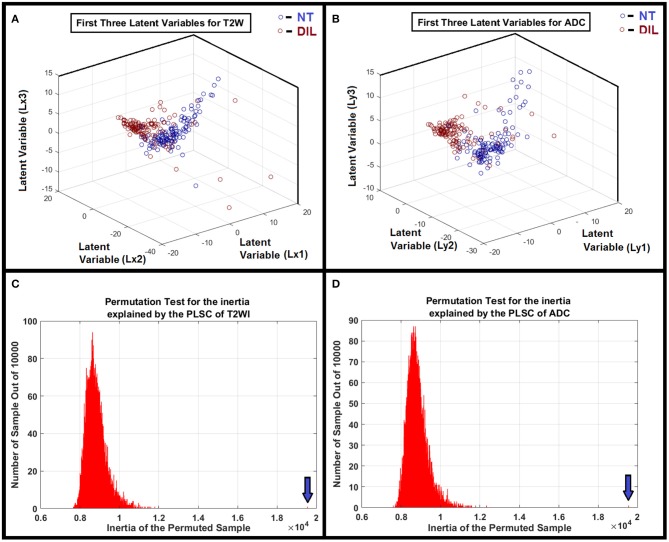
Figure 3.
(A,B) Clusters of NTs and DILs for each latent variable are well-separated with less diffusivity. It confirms that the distribution of the identified latent variable (PLSC-ANOVA) in the feature space is well-matched to its own cluster (less scattered) and poorly diffused to its neighboring clusters for the MR modalities. (C,D) Show the results of the permutation tests for the inertia explained by the PLSC of T2WI and ADC map for 10,000 permutations. As shown in the subfigures, the observed value (shown by vertical arrows) were never obtained in the 10,000 permutations for both modalities. Therefore, it is concluded that PLSC extracted a significant amount of common variance between these two modalities with P < 0.0001.

