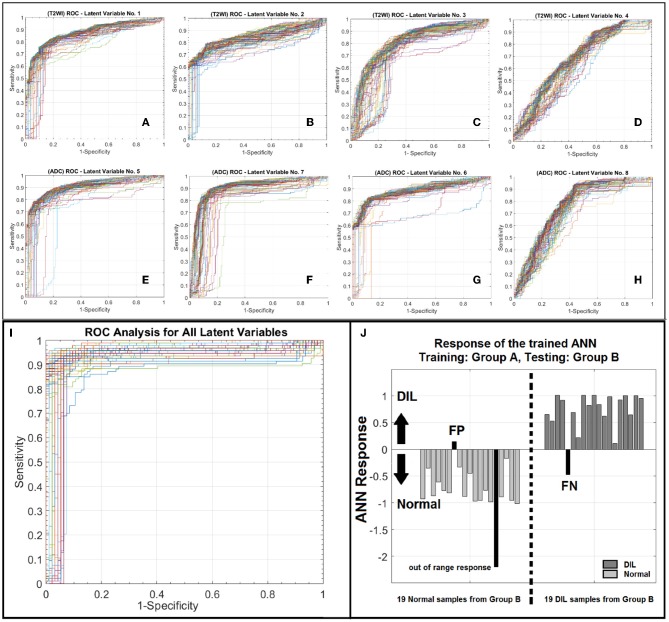
Figure 5.
(A–D) Depict ROC curves corresponding to 100 iterations each corresponding to a different division of training and validation datasets for ANN for the T2WI latent variables number 1–4. (E–H) depict ROC curves corresponding to 100 iterations each corresponding to a different division of training and validation datasets for ANN for the ADC latent variables number 1–4. As shown in this figure for each modality, from left to right as the order of latent variable increases the information content or discrimination power of the variable for classification deceases. (I) illustrates a family of ROC curves for 100 iterations, each corresponding to a different division of training and validation datasets for ANN for all 8 latent variables. (J) shows the response of the trained ANN against an unseen/prospective dataset (trained with group A and tested with group B).

