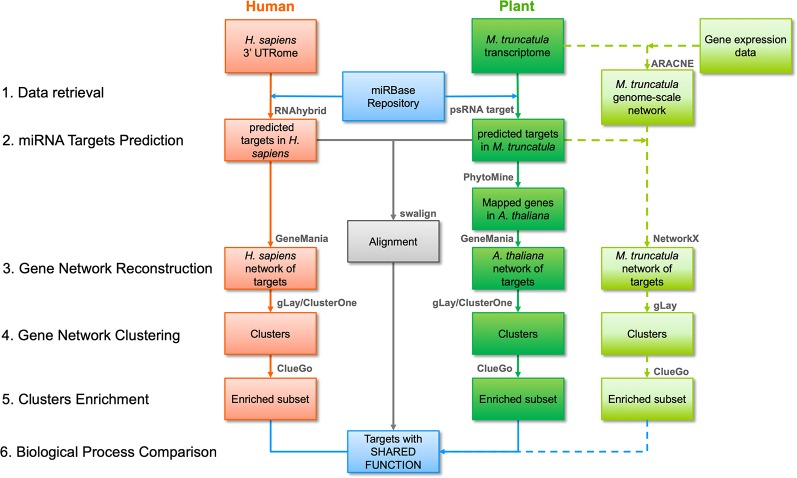
Figure 1.
Bioinformatic workflow followed in this work including network- and alignment-based analysis pipelines. The main steps of the network-based pipeline are numbered on the left, at the same level as the pipeline blocks indicating input and output of each step. Red and dark green blocks indicate human and plant inputs/outputs, respectively, and data flow is reported with arrows. The main software tools or functions (detailed in the main text) are summarized above each block. Light green blocks indicate inputs/outputs for the Medicago truncatula network-based pipeline, also including genome-scale network construction, and its data flow is reported as dashed arrows. The outputs of the alignment-based pipeline are reported as a single grey block indicating the sequences with significant similarity after alignment. Blue blocks indicate the initial and final data for human and plant in both analysis pipelines.

