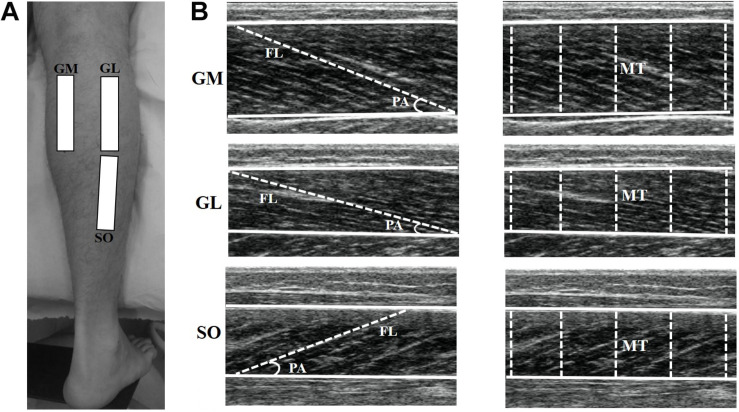
FIGURE 1.
Representation of the ultrasound sites in the gastrocnemius medialis (GM), gastrocnemius lateralis (GL), and soleus (SO) muscles (A). The ultrasonography images show GM, GL, and SO muscles (B). For each muscle, superficial and deep aponeuroses are visualized (continuous lines), among which the fascicle length (FL) and muscle thickness (MT) were measured. Pennation angle (PA) was calculated as the angle between the muscle fascicle and the deep aponeurosis.

