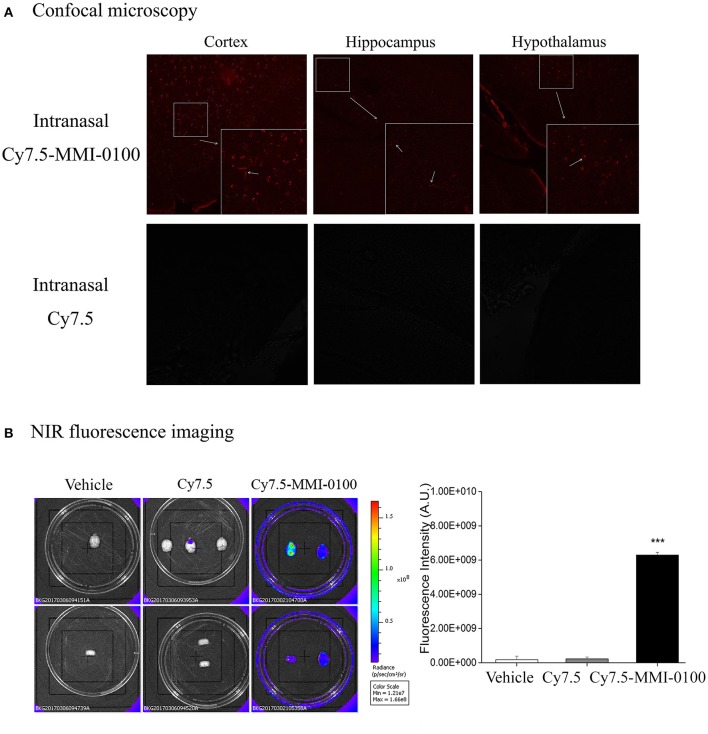
Figure 11.
(A) Confocal microscopy images of cortex, hippocampus, and hypothalamus of mouse brain after intranasal injection with Cy7.5 alone or Cy7.5-MMI-0100. (B) Ex vivo NIR fluorescence imaging and fluorescence intensity of perfused mouse brains 2 h after intranasal injection of the Cy7.5-MMI-0100, Cy7.5 alone, and saline as controls. All data are expressed as mean ± SEM and were analyzed by one-way ANOVA followed by Dunnett's post-hoc test. n = 4/group. ***p < 0.001 compared with Cy7.5 vs. Cy7.5-MMI-0100. Vertical lines represent mean ± SEM.

