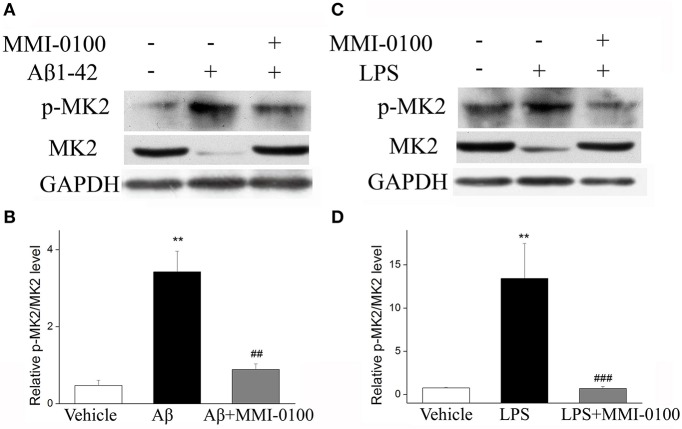
Figure 7.
Effects of MMI-0100 treatment on the expression of pMK2 in the hippocampus. (A,C) Western blot analysis of pMK2 in the hippocampus in each group. (B,D) B/D is quantification of pMK2 expressed as the ratio of pMK2/tMK2. Values were expressed as mean ± SEM, n = 5 in each group. **p < 0.01 compared with the vehicle group vs. the Aβ1−42 or LPS group, ##p < 0.01 and ###p < 0.001 compared with the Aβ1−42 or LPS group vs. Aβ1−42 + MMI-0100 or LPS + MMI-0100 group.

