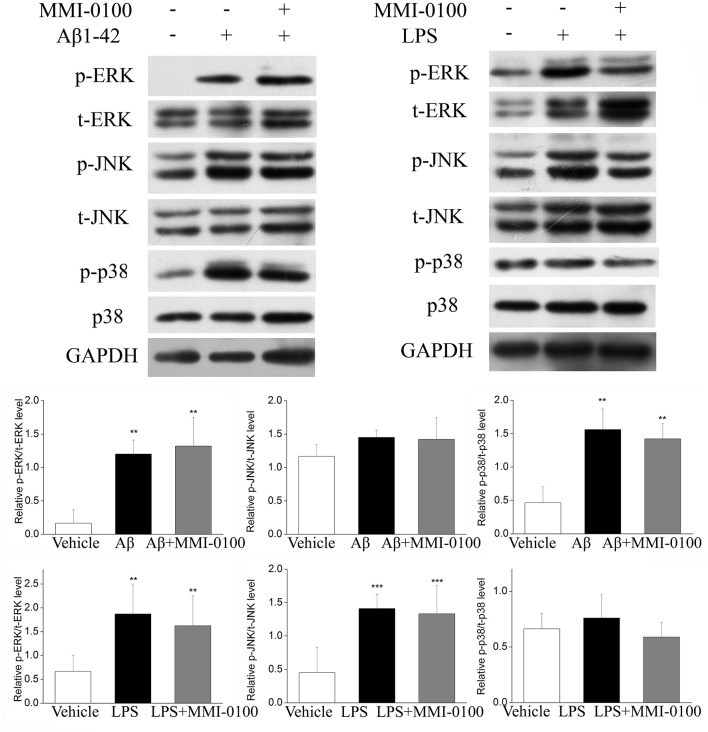
Figure 8.
Effect of MMI-0100 on Aβ1−42- or LPS-induced activation of MAPK in the hippocampus in mice. The upper panel is a representative immunoblot of pERK, tERK, pJNK, tJNK, p38, and p-p38 detected by Western blotting; the lower panel is quantification of MAPK signaling pathway-related protein expressed as the ratio of pERK/tERK, pJNK/tJNK, and p-p38/p38. Values were expressed as mean ± SEM, n = 5 in each group. **p < 0.01 and ***p < 0.001 compared with vehicle group.

