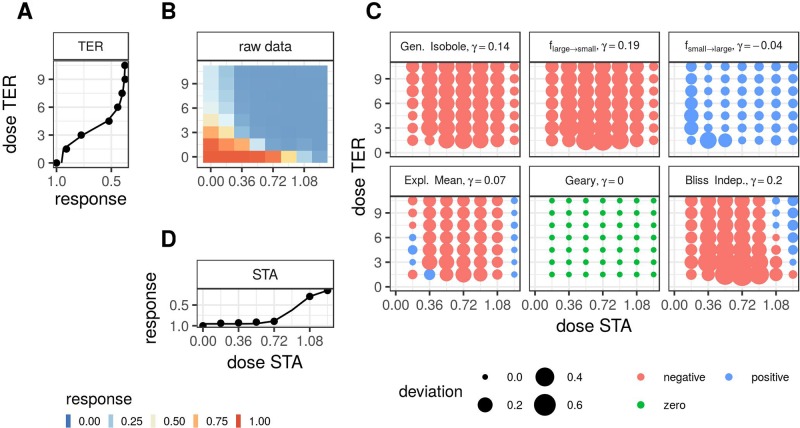
Figure 1.
Description of the analysis steps of the lack-of-fit method for the compound pair TER and STA from the Cokol dataset. This compound pair is categorized as synergistic according to Cokol et al. (2011). The raw response data of the record is depicted in panel (B). The response data normalized by the read at zero dose concentration (lower left). The degree of relative cell growth is colored from high to low values in red to blue. Step 1: compute Hill curves for conditional responses: Fit a Hill curve to the conditional responses, based on the raw reads of the single dose responses (lower and left outer edges). The fitted Hill curves are shown with the original raw data as points in panel (A), which is rotated by 90 degrees, such that the vertical x-axis is parallel to the y-axis of panel (B), since both axes denote the same doses of the same compound, and in panel (D), which is flipped along the horizontal x-axis. Step 2: compute expected non-interactive response for all six models: not shown. Step 3: compute difference between measured data (C) and expected data from all six null reference models: shown in panel (C). The direction of difference is shown by color (red for negative and blue for positive, green for zero). The larger the degree of difference, the larger the bullet, and vice versa. Step 4: compute integral γ over the differences: For every model, the synergy score γ is depicted in the title of each matrix in panel (C).

