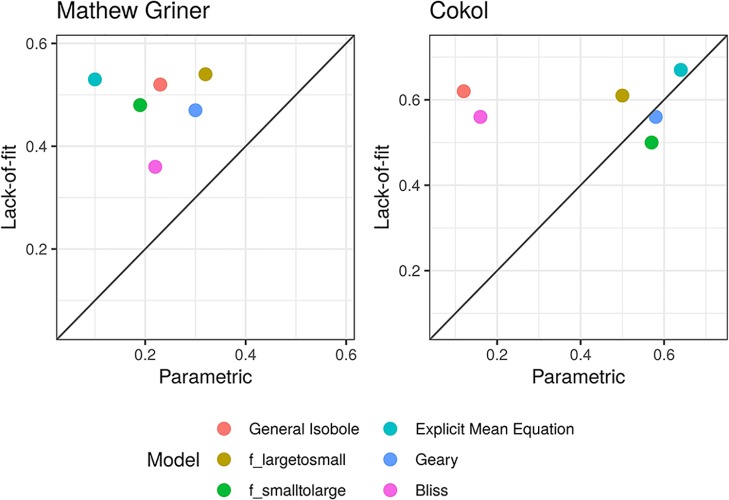
Figure 2.
Scatter plot of Kendall rank correlation coefficient for both datasets, Mathews Griner (left) and Cokol (right). The Kendall correlation measures the rank correlation of the original categorization and the computed synergy scores. The higher the correlation, the more similar the score ranking. The correlation values from the synergy scores α, computed with the parametric approach, are plotted on the x-axis and those from the lack-of-fit approach are plotted on the y-axis. Each model is depicted in a different color. To guide the eye, the diagonal is plotted. If a data point is above the diagonal, the Kendall rank correlation coefficient from the lack-of-fit method is higher than that from the parametric method, and vice versa. Without exception, the Kendall rank correlation coefficients are all higher for the synergy scores γ, which are computed with the lack-of-fit method, than those based on the α scores computed with the parametric method.

