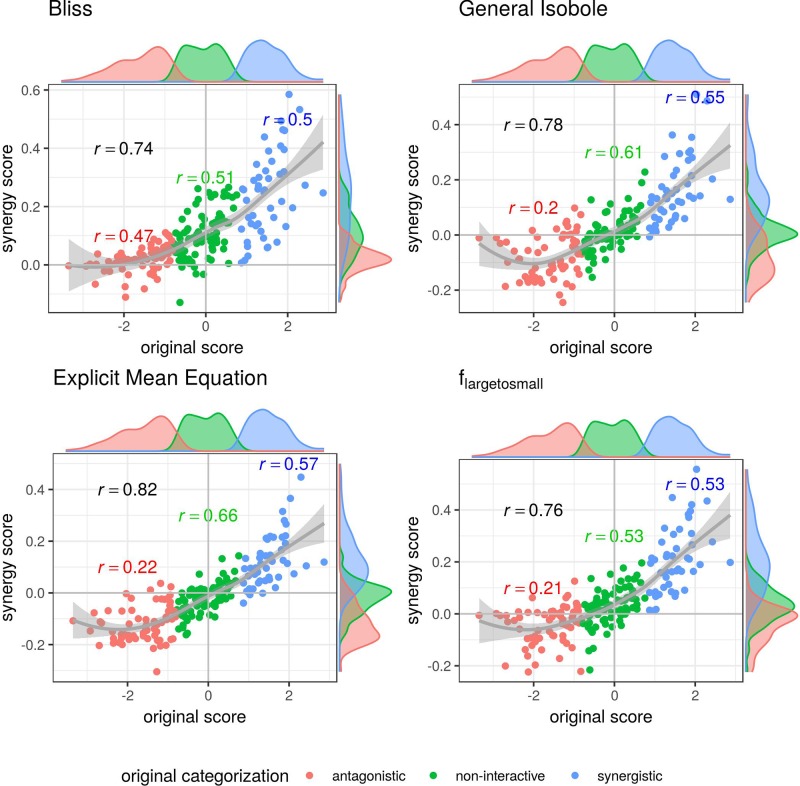
Figure 3.
Computed synergy scores γ of the Cokol data of the best models according to the Kendall in rank correlation coefficient and the receiver operating characteristic (ROC) analysis in Supplementary Material in comparison to the original scores from Cokol et al. (2011). The data points are colored based on the original categorization. For all three categories, synergistic, non-interactive, and antagonistic, the Pearson correlation is depicted between the original scores in that category and the computed synergy scores in the respective color. Additionally, we depict the local polynomial regression fitting of all scores (in gray). The histograms of the scores are plotted on the axis, separated by color based on the original categorization. Synergy scores γ based on the Explicit Mean Equation model show the highest correlation with the original scores.

