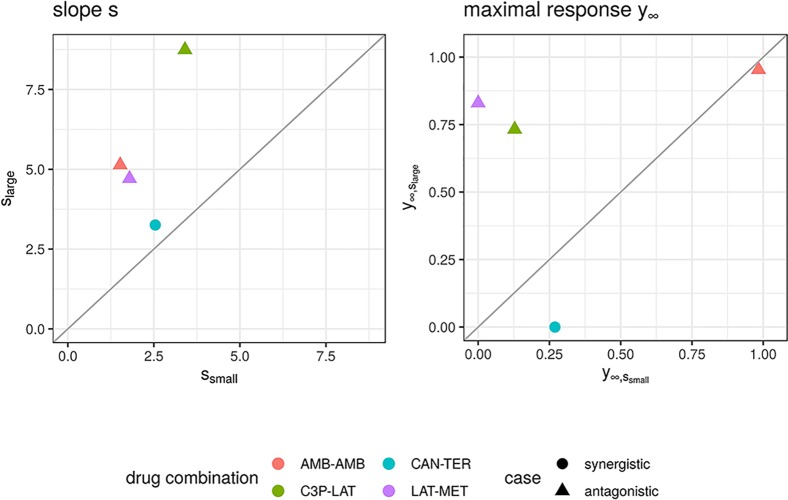
Figure 6.
Maximal response y∞ (left) and slope parameters s (right) of Hill curves. Parameters are shown for the conditional responses of the four cases for which the lack-of-fit method resulted for fmean(x1, x2) and fGI(x1, x2) in a synergy score of opposite sign to its categorization from the Cokol dataset. Different records are depicted in different colours. The original categorization of each record is depicted per shape. The conditional responses of one record, and hence their Hill curve parameters, are grouped depending on size of the Hill curve parameter s (larger or smaller).

