Figure 5.

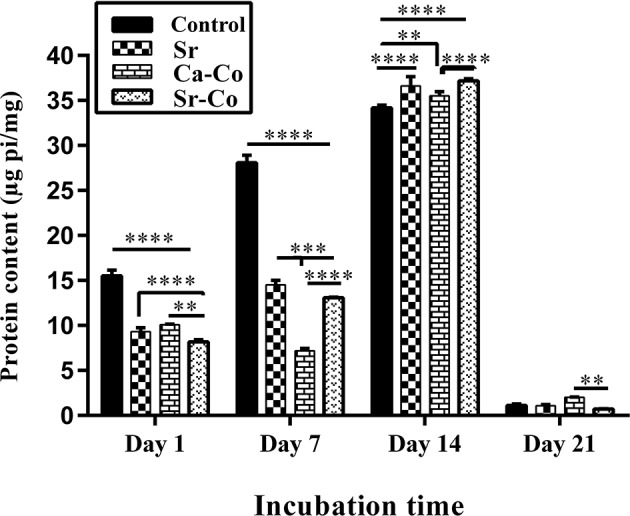
The graph showing the amounts of ALP produced by iPSCs after culturing onto the glass samples. *p < 0.05, **p < 0.01, ***p < 0.001, and ****p < 0.0001.

The graph showing the amounts of ALP produced by iPSCs after culturing onto the glass samples. *p < 0.05, **p < 0.01, ***p < 0.001, and ****p < 0.0001.