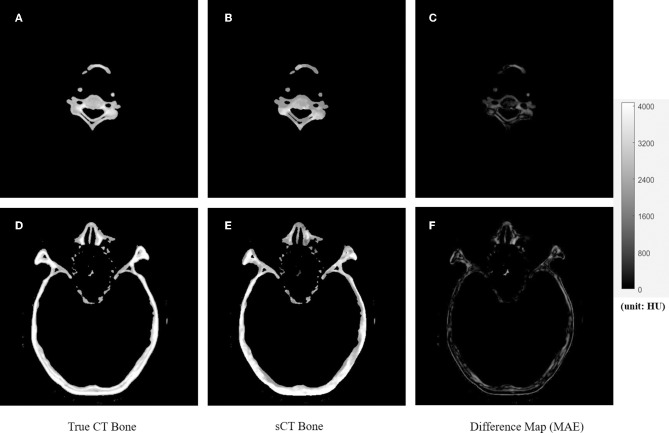
Figure 4.
The comparison of true CT and synthetic CT for bone. The first column is true CT images. The second column is the synthetic CT images. The third column is the difference maps. (A–C) Showed bone in the neck region. (D–F) Showed bone in the head and nasal region. Gray bar indicated the mapping from CT number to gray scale in the difference maps.

