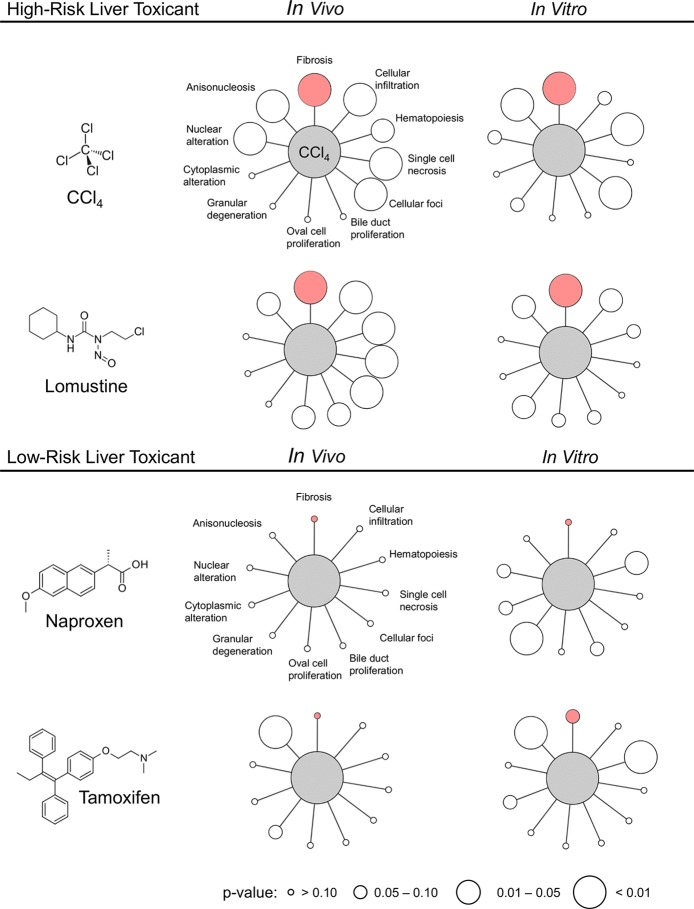
Figure 4.
Activation of liver injury modules in vitro and in vivo in rat hepatocytes after exposure to high- and low-risk liver toxicants. Pink indicates the Fibrosis module and the size of the circle indicates the p-value. The image was generated using Cytoscape (Shannon et al., 2003).

