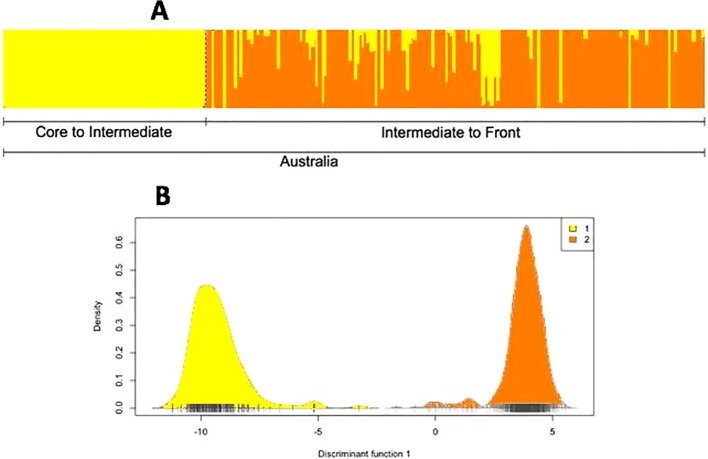
Figure 5.
(A) Population structure of cane toads across their invasive range in Australia, as inferred from running fastStructure on single nucleotide polymorphisms (SNPs) from restriction site-associated DNA sequencing (RADSeq) data. Because coordinate metadata for collection sites were unavailable, the samples could not be arranged from east to west along the Australian range. (B) Population structure of cane toads across their invasive range in Australia, as inferred from discriminant analysis of principal components on SNPs from RADSeq data.

