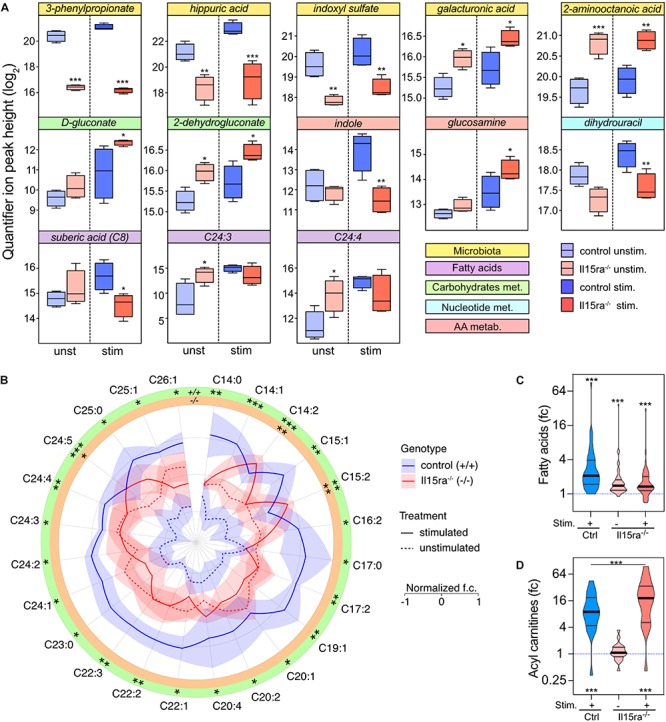
FIGURE 6.

Univariate analysis of the effect of genotype. (A) 2-way ANOVA with multiple comparisons of metabolites with significant interaction between stimulation and genotype. Data are represented as mean ± SEM. (B) Radar chart representation of the levels of fatty acids significantly mobilized upon stimulation in control (blue lines) and Il15ra–/– (red lines) EDL muscles. The fold changes of each fatty acid have been normalized (mean 0 and variance 1) for visualization purposes. Violin plots of mobilization of the total fatty acids (C) and carnitine (D) pools detected by the assay. In panels (C) and (D), the dashed line represents controls unstimulated. Statistical significance was calculated vs. control unstimulated using one-way ANOVA on log2-transformed intensities before conversion to fold change. ∗P < 0.05, ∗∗P < 0.01, and ∗∗∗P < 0.001.
