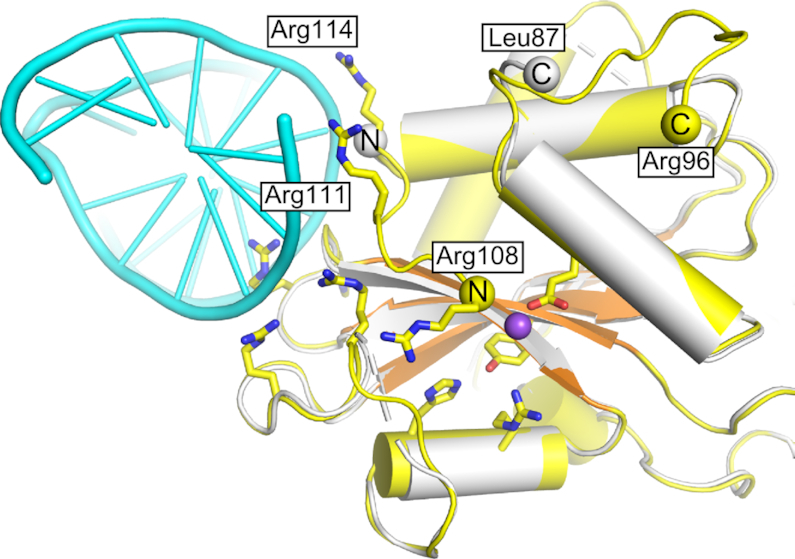
Figure 2.

Structural differences at the new DNA-binding interface between apo and DNA-bound Tt-Slx1. The DNA-bound structure is shown in yellow/orange for protein and cyan for DNA. DNA binding residues, and active site residues are shown as yellow sticks. The superimposed apo structure is shown in white. Yellow/white spheres indicate termini that flank regions that are not visible in the structures. The position of the catalytic metal ion, modeled based on the structure of Hpy188I-DNA complex (PDB ID: 3OQG) (39), is shown as a purple sphere.
