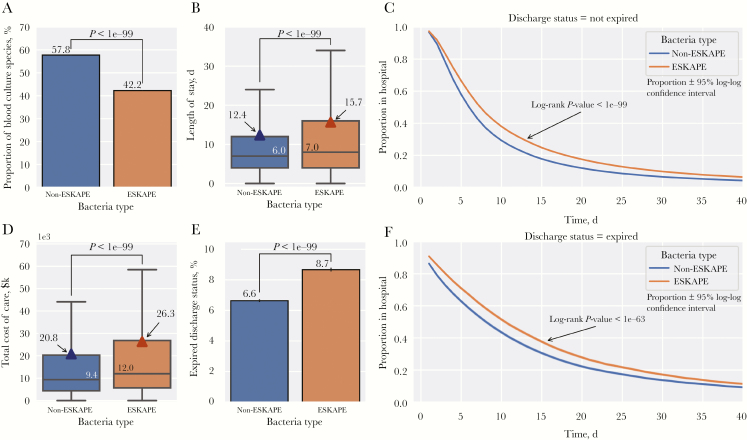
Figure 2.
Impact of ESKAPE pathogens on patient outcomes. A, Relative proportions (±95% Wilson confidence intervals) of ESKAPE and non-ESKAPE pathogens. B, Patient length of stay by bacteria type with boxplot (median ± interquartile range [IQR]) overlaid with means (triangles). C, Proportion of patients in the hospital by length of stay and bacteria type for surviving patients. D, Total cost of care by bacteria type with boxplot (median ± IQR) overlaid with means (triangles). E, Proportion of patients expired at discharge by bacteria type (±95% confidence interval). F, Proportion of patients in hospital by length of stay by bacteria type for expired patients.

