Figure 13.

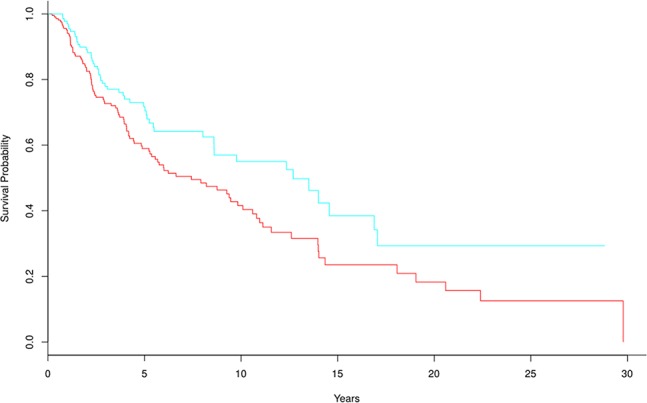
Kaplan-Meier survival curves for TCGA-SKCM based on biomarker genes from GSE35640; p-value = 0.016. There were 281 and 166 samples in the high-risk and low-risk groups, respectively.

Kaplan-Meier survival curves for TCGA-SKCM based on biomarker genes from GSE35640; p-value = 0.016. There were 281 and 166 samples in the high-risk and low-risk groups, respectively.