Figure 5.

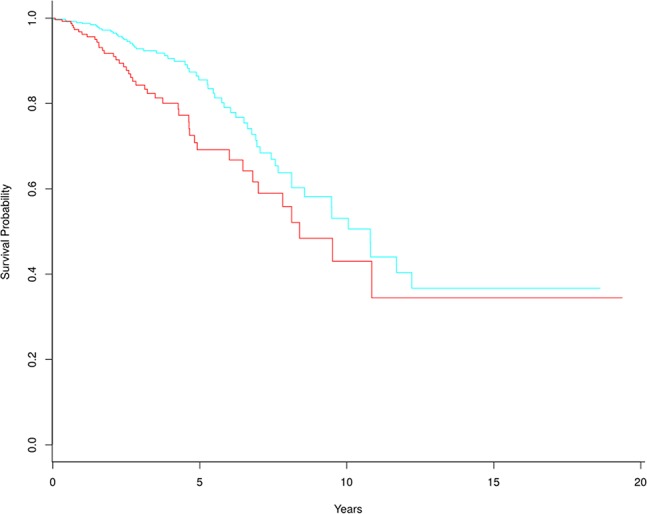
Kaplan-Meier survival curves based on 305 tumor biomarker genes. In the high-risk group (red line), there are 329 tumor samples. In the low-risk group (blue line), there are 759 tumor samples.

Kaplan-Meier survival curves based on 305 tumor biomarker genes. In the high-risk group (red line), there are 329 tumor samples. In the low-risk group (blue line), there are 759 tumor samples.