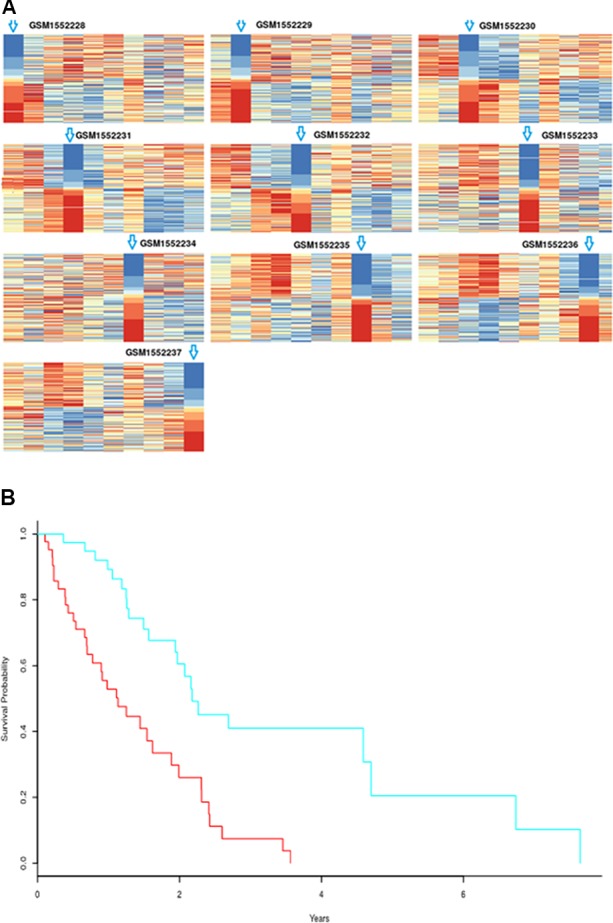
Figure 9.

(A) Rank matrix of each response sample. (B) Kaplan-Meier survival curves for human mesothelioma tumor samples based on biomarker genes from mouse AB1-HA tumor samples; p-value=1.57×10⁻⁵. High-risk group includes 44 samples; low-risk group consists of 40 samples.
