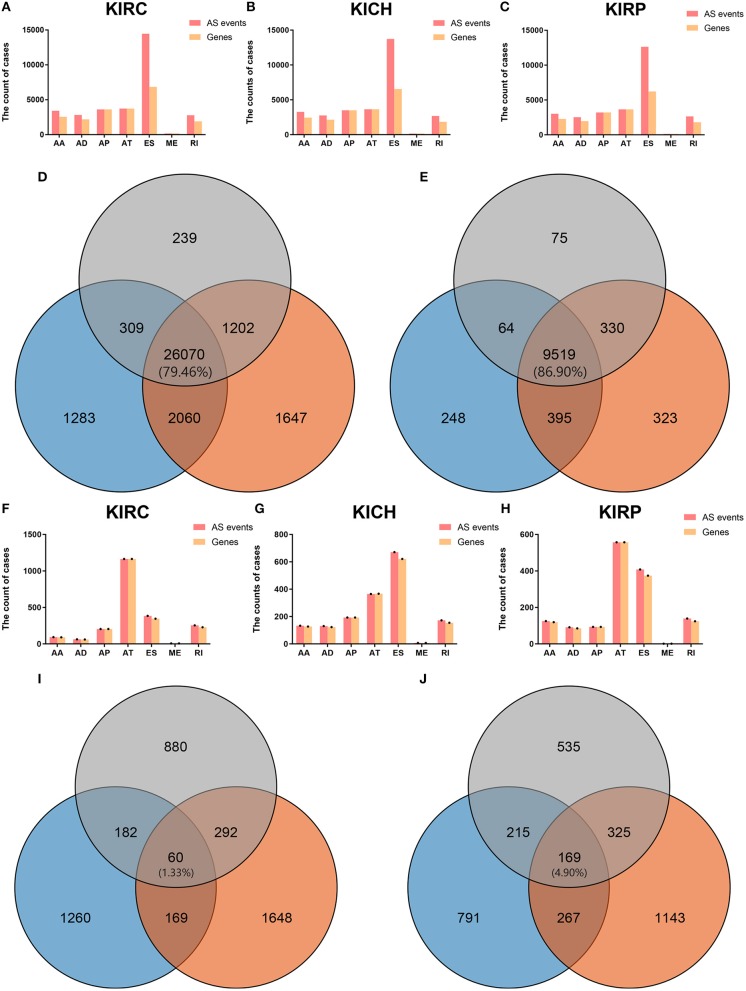
Figure 1.
The AS events, SREs and relevant genes in RCC. (A–C) The height of the pink strip represented the number of AS events. The height of the orange band represented the number of relevant genes. (D) The orange, blue, and gray areas represent the events in KIRC, KICH, and KIRP, respectively. The percentage value in the middle represented the ratio of the AS events co-existing in the three sets to all AS events. (E) The orange, blue, and gray areas represent the genes in KIRC, KICH, and KIRP, respectively. The percentage value in the middle represented the ratio of the ASRGs co-existing in the three sets to all ASRGs. (F–H) The height of the pink strip represented the number of SREs. The height of the orange strip represented the number of SRGs. Because the number of MEs and ME related genes was too small; black dots on the bar graph indicated their existence. (I) The orange, blue, and gray areas represent the SREs in KIRC, KICH, and KIRP, respectively. The percentage value in the middle represented the ratio of the SREs co-existing in the three sets to all SREs. (J) The orange, blue, and gray areas represent the SRGs in KIRC, KICH, and KIRP, respectively. The percentage value in the middle represented the ratio of the SRGs co-existing in the three sets to all SRGs.

