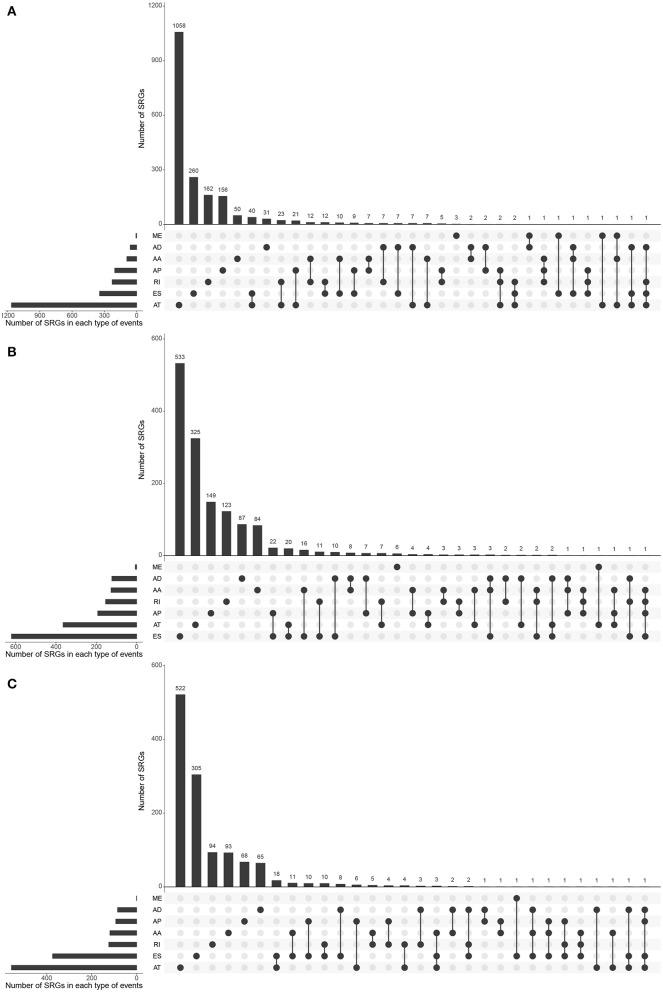
Figure 3.
The distributions of SREs and SRGs in each kind of RCC. The strip at the bottom left shows the number of SREs included in each AS type. The dot and line at the bottom right represent the subsets of AS events. The AS types corresponding to dots were contained in the subtype. The number of relevant genes in each subset is represented in the histogram, which is the upper part of the whole plot. (A) KIRC; (B) KICH; and (C) KIRP.

